1997 Northumberland County Council election
Local elections to Northumberland County Council, a county council in the north east of England, were held on 1 May 1997, resulting in a council with Labour members forming a majority.
| |||||||||||||||||||||||||||||||||||||||||||||||
All 66 seats to Northumberland County Council 34 seats needed for a majority | |||||||||||||||||||||||||||||||||||||||||||||||
|---|---|---|---|---|---|---|---|---|---|---|---|---|---|---|---|---|---|---|---|---|---|---|---|---|---|---|---|---|---|---|---|---|---|---|---|---|---|---|---|---|---|---|---|---|---|---|---|
| Turnout | 71.8% | ||||||||||||||||||||||||||||||||||||||||||||||
| |||||||||||||||||||||||||||||||||||||||||||||||
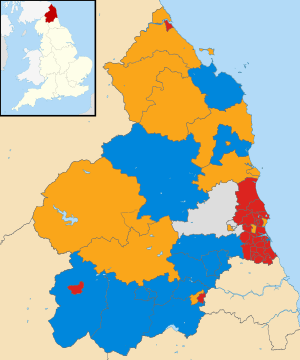 Map of the results of the 1997 local election. | |||||||||||||||||||||||||||||||||||||||||||||||
| |||||||||||||||||||||||||||||||||||||||||||||||
Results
| Party | Seats | Gains | Losses | Net gain/loss | Seats % | Votes % | Votes | +/− | |
|---|---|---|---|---|---|---|---|---|---|
| Labour | 43 | 65.2 | 44.8 | 72,674 | |||||
| Conservative | 13 | 19.7 | 24.4 | 39,519 | |||||
| Liberal Democrats | 8 | 12.1 | 26.0 | 42,219 | |||||
| Independent | 2 | 3.0 | 3.7 | 6,040 | |||||
| Green | 0 | 0.0 | 0.7 | 1,150 | |||||
| Liberal | 0 | 0.0 | 0.4 | 608 | New | ||||
gollark: Instead of having an emoji per flag, they just have the regional indicators, which spell out two letter country codes.
gollark: You see, the regional indicators are designed to act as a replacement for having the Consortium define all the country flags, which would cause problems.
gollark: DO YOU NOT KNOW HOW REGIONAL INDICATORS WORK
gollark: If I add a command like that, it'll allow you to upvote and downvote letters to bias the results.
gollark: I added some code to the bot to make it put lyriclys last.
References
- "Local Election Summaries 1997". The Elections Centre. Retrieved 21 June 2019.
- p.10
External links
| Northumberland County Council | |
|---|---|
| Alnwick District Council | |
| Berwick-upon-Tweed Borough Council |
|
| Blyth Valley Borough Council |
|
| Castle Morpeth Borough Council |
|
| Tynedale District Council | |
| Wansbeck District Council |
|
| |
| County councils |
|
|---|---|
| Unitary authorities |
|
| District councils (England) |
|
| District councils (Northern Ireland) |
|
| Sui generis |
|
| Referendums | |
| |
This article is issued from Wikipedia. The text is licensed under Creative Commons - Attribution - Sharealike. Additional terms may apply for the media files.