1989 Northumberland County Council election
Local elections to Northumberland County Council, a county council in the north east of England, were held on 4 May 1989, resulting in a council with Labour members forming a majority.
| |||||||||||||||||||||||||||||||||||||||||||||||
All 66 seats to Northumberland County Council 34 seats needed for a majority | |||||||||||||||||||||||||||||||||||||||||||||||
|---|---|---|---|---|---|---|---|---|---|---|---|---|---|---|---|---|---|---|---|---|---|---|---|---|---|---|---|---|---|---|---|---|---|---|---|---|---|---|---|---|---|---|---|---|---|---|---|
| Turnout | 37.5% | ||||||||||||||||||||||||||||||||||||||||||||||
| |||||||||||||||||||||||||||||||||||||||||||||||
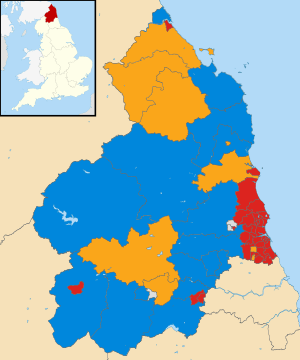 Map of the results of the 1989 local election. | |||||||||||||||||||||||||||||||||||||||||||||||
| |||||||||||||||||||||||||||||||||||||||||||||||
Results
| Party | Seats | Gains | Losses | Net gain/loss | Seats % | Votes % | Votes | +/− | |
|---|---|---|---|---|---|---|---|---|---|
| Labour | 38 | 57.6 | 40.4 | 35,288 | |||||
| Conservative | 17 | 25.8 | 23.3 | 20,346 | |||||
| SLD | 8 | 12.1 | 28.3 | 24,782 | |||||
| Independent | 3 | 4.5 | 4.1 | 3,546 | |||||
| Green | 0 | 0.0 | 0.8 | 701 | |||||
| SDP (1988) | 0 | 0.0 | 2.3 | 2,017 | |||||
| Liberal | 0 | 0.0 | 0.6 | 774 | |||||
gollark: Use a tty?
gollark: Use a live USB?
gollark: No.
gollark: Have you *seen* my reminders?
gollark: Yes. Also my past selves. It's very efficient.
References
- "Local Election Summaries 1989". The Elections Centre. Retrieved 21 June 2019.
- p.188
External links
| Northumberland County Council | |
|---|---|
| Alnwick District Council | |
| Berwick-upon-Tweed Borough Council |
|
| Blyth Valley Borough Council |
|
| Castle Morpeth Borough Council |
|
| Tynedale District Council | |
| Wansbeck District Council |
|
| |
| County councils (England) |
|
|---|---|
| County councils (Wales) |
|
| District councils (Northern Ireland) |
|
| Sui generis |
|
| |
This article is issued from Wikipedia. The text is licensed under Creative Commons - Attribution - Sharealike. Additional terms may apply for the media files.