1994 Mecklenburg-Vorpommern state election
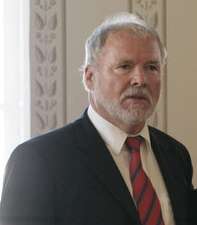
The 1994 Mecklenburg-Vorpommern state election was held on 16 October 1994 to elect the members of the 2nd Landtag of Mecklenburg-Vorpommern. The incumbent government was a coalition of the Christian Democratic Union (CDU) and Free Democratic Party (FDP) led by Minister-President Berndt Seite. While the CDU remained the largest party in the Landtag, the FDP suffered a 1.7-point swing and lost all its seats. The CDU subsequently formed a grand coalition with the Social Democratic Party (SPD), and Seite continued in office.
| ||||||||||||||||||||||||||||||||||||||||||||||||||||||||
All 66 seats in the Landtag of Mecklenburg-Vorpommern 34 seats needed for a majority | ||||||||||||||||||||||||||||||||||||||||||||||||||||||||
|---|---|---|---|---|---|---|---|---|---|---|---|---|---|---|---|---|---|---|---|---|---|---|---|---|---|---|---|---|---|---|---|---|---|---|---|---|---|---|---|---|---|---|---|---|---|---|---|---|---|---|---|---|---|---|---|---|
| Turnout | 977,867 (72.9%) | |||||||||||||||||||||||||||||||||||||||||||||||||||||||
| ||||||||||||||||||||||||||||||||||||||||||||||||||||||||
| ||||||||||||||||||||||||||||||||||||||||||||||||||||||||
Parties
The table below lists parties represented in the 1st Landtag of Mecklenburg-Vorpommern.
| Name | Ideology | Leader(s) | 1990 result | |||
|---|---|---|---|---|---|---|
| Votes (%) | Seats | |||||
| CDU | Christian Democratic Union of Germany Christlich Demokratische Union Deutschlands |
Christian democracy | Berndt Seite | 39.4%[lower-alpha 2] | 29 / 66 | |
| SPD | Social Democratic Party of Germany Sozialdemokratische Partei Deutschlands |
Social democracy | Harald Ringstorff | 27.0% | 21 / 66 | |
| PDS | Party of Democratic Socialism Partei des Demokratischen Sozialismus |
Democratic socialism | 15.7% | 12 / 66 | ||
| FDP | Free Democratic Party Freie Demokratische Partei |
Classical liberalism | 5.5% | 4 / 66 | ||
Election result
Summary of the 16 October 1994 election results for the Landtag of Mecklenburg-Vorpommern
| Party | Votes | % | +/- | Seats | +/- | Seats % | |
|---|---|---|---|---|---|---|---|
| Christian Democratic Union (CDU) | 368,206 | 37.7 | 30 | 42.3 | |||
| Social Democratic Party (SPD) | 288,431 | 29.5 | 23 | 32.4 | |||
| Party of Democratic Socialism (PDS) | 221,814 | 22.7 | 18 | 25.4 | |||
| Free Democratic Party (FDP) | 37,498 | 3.8 | 0 | 0 | |||
| Alliance 90/The Greens (Grüne) | 36,035 | 3.7 | 0 | ±0 | 0 | ||
| Others | 25,883 | 2.6 | 0 | ±0 | 0 | ||
| Total | 977,867 | 100.0 | 66 | ±0 | |||
| Voter turnout | 72.9 | ||||||
Notes
- Results for the CDU (38.3%) and CSU (1.1%).
- Results for the CDU (38.3%) and CSU (1.1%).
- Compared to results for the CDU (38.3%) and CSU (1.1%).
- Compared to results for the CDU (30 seats) and CSU (0 seats).
- Compared to results for The Greens (4.2%), New Forum (2.9%), and Alliance 90 (2.2%).
Sources
gollark: I looked at the docs briefly.
gollark: JPEG 2000 is an old image compression codec.
gollark: I mean, mine "work".
gollark: Just test better?
gollark: Do you NOT have your own automated tests, LyricLy?
This article is issued from Wikipedia. The text is licensed under Creative Commons - Attribution - Sharealike. Additional terms may apply for the media files.
_by_Guenter_Prust.jpg)
