1989 South African general election
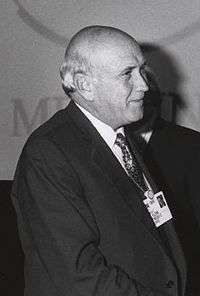
The 1989 South African general election, held on 6 September of that year, was South Africa's last national race-based parliamentary election. The election was called early (no election was required until 1992) to gauge support for the recently-elected head of the National Party, F. W. de Klerk, who was in the process of replacing P. W. Botha as the country's president, and the new leader's program of reform to include further retreat from the policy of apartheid.
| |||||||||||||||||||||||||||||||||||||||||||||
All 166 elected seats in the House of Assembly All 80 elected seats in the House of Representatives All 40 elected seats in the House of Delegates | |||||||||||||||||||||||||||||||||||||||||||||
|---|---|---|---|---|---|---|---|---|---|---|---|---|---|---|---|---|---|---|---|---|---|---|---|---|---|---|---|---|---|---|---|---|---|---|---|---|---|---|---|---|---|---|---|---|---|
| Turnout | 69.5% | ||||||||||||||||||||||||||||||||||||||||||||
| |||||||||||||||||||||||||||||||||||||||||||||
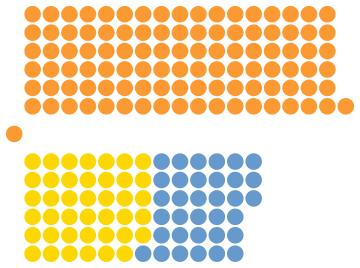
 House of Assembly after the 1989 election | |||||||||||||||||||||||||||||||||||||||||||||
| |||||||||||||||||||||||||||||||||||||||||||||
 |
|---|
| This article is part of a series on the politics and government of South Africa |
|
|
|
Related topics |
|
|
Although it won an absolute majority, the National Party suffered an electoral setback and won only 48% of the popular vote and 103 of the seats in the House of Assembly.
The official opposition Conservative Party (CP), which opposed any form of power-sharing with other races, remained the official opposition with 41 seats and gained 31% of the votes.
Before the elections, the liberal Progressive Federal Party (PFP) had dissolved itself and regrouped as the Democratic Party (DP) and won 34 seats.
House of Assembly (White)
| Party | Votes | % | Seats | ||||
|---|---|---|---|---|---|---|---|
| Directly-elected | Additional | Total | +/– | ||||
| National Party | 1,039,704 | 48.2 | 94 | 9 | 103 | −21 | |
| Conservative Party | 680,131 | 31.5 | 39 | 2 | 41 | +19 | |
| Democratic Party | 431,444 | 20.0 | 33 | 1 | 34 | +15 | |
| Herstigte Nasionale Party | 5,416 | 0.2 | 0 | 0 | 0 | 0 | |
| Independent | 898 | 0.0 | 0 | 0 | 0 | 0 | |
| Invalid/blank votes | 10,336 | – | – | – | – | – | |
| Total | 2,167,929 | 100 | 166 | 12 | 178 | +11 | |
| Registered voters/turnout | 3,120,104 | 69.5 | – | – | – | – | |
| Source: IPU | |||||||
The White Chamber of Parliament had 178 members, 166 of whom were directly elected (including a seat from Walvis Bay, which was added in 1981) with 8 members indirectly elected by the directly elected members on the basis of proportional representation and 4 nominated by the State President (one from each province).[1]
The results of the election were interpreted by the government (based on support for the NP and the DP together) as a mandate from the white electorate to forsake the apartheid system and seek a compromise with the African National Congress and its leader Nelson Mandela.
House of Representatives (Coloured)
| Party | Votes | % | Seats | |||
|---|---|---|---|---|---|---|
| Elected | Appointed | Total | +/– | |||
| Labour Party | 171,930 | 65.0 | 69 | 5 | 74 | −2 |
| Democratic Reform Party | 39,741 | 15.2 | 5 | 0 | 5 | +5 |
| United Democratic Party | 19,261 | 7.6 | 3 | 0 | 3 | +3 |
| Freedom Party | 1,949 | 0.7 | 1 | 0 | 1 | 0 |
| Independents | 24,705 | 9.4 | 2 | 0 | 2 | +1 |
| Invalid/blank votes | 2,861 | – | – | – | – | – |
| Total | 261,047 | 100 | 80 | 5 | 85 | +5 |
| Registered voters/turnout | 1,439,112 | 18.1 | – | – | – | – |
| Source: IPU, African Elections Database | ||||||
House of Delegates (Indian)
| Party | Votes | % | Seats | |||
|---|---|---|---|---|---|---|
| Elected | Appointed | Total | +/– | |||
| Solidarity | 58,216 | 37.6 | 16 | 3 | 19 | +2 |
| National People's Party | 38,523 | 24.9 | 8 | 1 | 9 | −9 |
| Democratic Party | 10,427 | 6.7 | 3 | 0 | 3 | +3 |
| National Federal Party | 8 058 | 5.2 | 1 | 0 | 1 | +1 |
| People's Party of South Africa | 6 064 | 3.9 | 1 | 0 | 1 | +2 |
| United Party | 2 712 | 1.8 | 0 | 0 | 0 | 0 |
| Merit People's Party | 2 078 | 1.3 | 3 | 1 | 4 | +4 |
| Progressive Independent Party | 1 497 | 1.0 | 0 | 0 | 0 | −1 |
| Freedom Party | 703 | 0.7 | 2 | 0 | 2 | +2 |
| Republican Party | 701 | 0.7 | 0 | 0 | 0 | 0 |
| Independents | 24 157 | 15.6 | 6 | 0 | 6 | +2 |
| Invalid/blank votes | 1,388 | – | – | – | – | – |
| Total | 154,524 | 100 | 40 | 5 | 45 | +5 |
| Registered voters/turnout | 663,604 | 23.3 | – | – | – | – |
| Source: IPU, African Elections Database | ||||||


