1929 South African general election
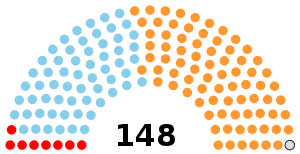
In the 1929 South African general election, held on 12 June 1929,[1] the National Party under James Barry Munnik Hertzog won an outright majority in the House of Assembly. Hertzog had the opportunity to form a government without the aid of the Labour Party. In fact the Pact government continued, with two ministers from the Creswell Labour faction remaining in office. The National Party remained the dominant party, for its second consecutive term.
| |||||||||||||||||||||||||||||||||||||
All 148 seats in the House of Assembly 75 seats needed for a majority | |||||||||||||||||||||||||||||||||||||
|---|---|---|---|---|---|---|---|---|---|---|---|---|---|---|---|---|---|---|---|---|---|---|---|---|---|---|---|---|---|---|---|---|---|---|---|---|---|
| Turnout | 75.33% ( | ||||||||||||||||||||||||||||||||||||
| |||||||||||||||||||||||||||||||||||||
 House of Assembly after the election | |||||||||||||||||||||||||||||||||||||
| |||||||||||||||||||||||||||||||||||||
 |
|---|
| This article is part of a series on the politics and government of South Africa |
|
|
|
Related topics |
|
|
Due to the split in the Labour Party, just eight MPs were elected for the party, of whom only four sat on the government benches.[2]
Delimitation of electoral divisions
The South Africa Act 1909 had provided for a delimitation commission to define the boundaries for each electoral division. The representation by province, under the fifth delimitation report of 1928, is set out in the table below. The figures in brackets are the number of electoral divisions in the previous (1923) delimitation. If there is no figure in brackets then the number was unchanged.[3]
| Provinces | Cape | Natal | Orange Free State | Transvaal | Total |
|---|---|---|---|---|---|
| Divisions | 58 (51) | 17 | 18 (17) | 55 (50) | 148 (135) |
Results
The vote totals in the table below may not give a complete picture of the balance of political opinion, because of unopposed elections (where no votes were cast) and because contested seats may not have been fought by a candidate from all major parties.
The total registered electorate was 461,820. The votes cast were 347,924 (including 4,027 spoilt votes).[4]
| Party | Seats[5] | Seats % | Votes[6] | Votes % | Leader | |
| National Party | 78 | 52.70 | 141,579 | 41.16 | General J. B. M. Hertzog | |
| South African | 61 | 41.22 | 159,896 | 46.51 | General Jan Smuts | |
| Labour | 8 | 5.41 | 33,919 | 9.86 | Disputed[7] | |
| Independent | 1 | 0.68 | 8,503 | 2.47 | - | |
| Total | 148 | |||||
References
- "Elections in South Africa". African Elections Database. Retrieved 21 February 2016.
- The South African Constitution, page 135
- South Africa 1982, page 129
- South Africa 1982, page 176
- South Africa 1982, page 174 (seats by party)
- South Africa 1982, page 176 (votes by party)
- The leadership was in dispute between Colonel F. H. P. Creswell (of the Creswell Labour faction) and Walter Madeley (from the National Council Labour faction), following the 1928 split in the Labour Party - see South African Labour Party for more details.
Bibliography
- South Africa 1982: Official Yearbook of the Republic of South Africa, published by Chris van Rensburg Publications
- The South African Constitution, by H.J. May (3rd edition 1955, Juta & Co)
.jpg)
.jpg)