2

Is there a way to analyze SQL Slow query logs easily on log explorer or on some other GCP tool? Now log explorer writes log entries to multiple lines (textPayload divided) and it's hard to find out those slow performing queries.

So far I managed to get this, by help of article here (I think that article is outdated): enter image description here

Tim
  • 31
  • 3

2 Answers2

0

To easily analyze query logs, you can create a log-based metrics with the use of Cloud Monitoring.

Logs-based metrics are Cloud Monitoring metrics that are based on the content of log entries. For example, metrics can record the number of log entries containing particular messages, or they can extract latency information reported in log entries.

Basically, you would need to do the following:

  1. Start by filtering the Cloud Logging view to match the logs you want to measure

  2. Create the log-based metric

  3. Generate new data and view the new metric

Note: Metrics only start recording data after they have been created.

  1. Visualize slow query logs with Cloud Monitoring. You can make the metric more useful by parsing the slow SQL statements to be metric labels, which are visible in the dashboard legend in Cloud Monitoring.

Check this article for a more detailed steps.

Mabel A.
  • 140
  • 4
  • I tried that article, but it was outdated. The metric part was changed on google after that article has been published and could not solve problems on that... I try it again, but more detailed instructions would be beneficial. – Tim Mar 02 '22 at 06:30
  • @Timo can you let me know which step specifically has been changed? I'll try to help you with that. – Mabel A. Mar 02 '22 at 09:08
  • I have slow queries enabled and logs are on log explorer. The article instructions are working only if queries are short as they are on example. As soon as I filter with 'textPayload:("SELECT" OR "INSERT" OR "UPDATE" OR "CREATE" OR "DELETE")' I lose all long queries and see only the tip of my queries on log explorer. Most of slow queries we have are quite big queries and they are multiple lines on log explorer. – Tim Mar 02 '22 at 12:50
  • And if I continue with that article, and try to visualize (using regular expressions) it, then it goes wrong... At this point the instructions are outdated, you can see differences in screenshots. – Tim Mar 02 '22 at 13:02
  • @Timo losing long queries in the log explorer is an odd behavior. I suggest you open a [support case](https://cloud.google.com/support-hub) for further investigation. – Mabel A. Mar 07 '22 at 09:31
  • I am actually not losing those. Those are wrapped to multiple lines. And because those are on multiple lines I can not use the article shown here. Do you know that long queries should not be divided into multiple lines at all and I should raise a support ticket? – Tim Mar 08 '22 at 10:04
0

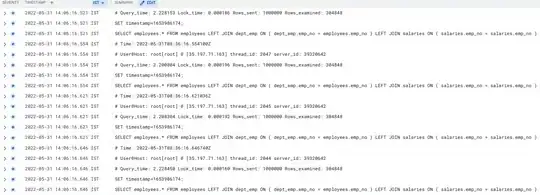
I reproduced your issue and yes you are correct, Cloud SQL MySQL log (general.log, slow.log) in Log Explorer shows up spitted by newline into multiple records and does not show the long queries as one record.

Reason : This is because there's a newline character in the input Query that is set to Cloud SQL. If the input query is single-line (does not contain \n), the output will be one log event, showing as one line in Log Explorer. If the input query is multi-line (contains \n), the output will be multiple log events and showing up as multiple logs. the records that they see in the general log are split into multiple records.

enter image description here

To let you know, this issue is already known to Google. There are no ETAs for its implementation. All communication/updates from the Cloud SQL Team regarding this feature request will be posted here or here