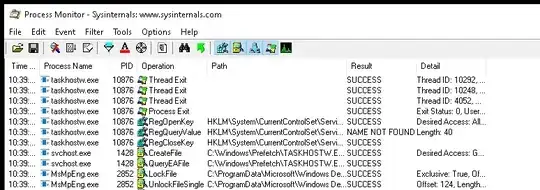
I regularly use Process Monitor to to debug an application that misbehaves very often. I don't develop the application so fixing the source code is not an option. The image below shows the kind of output I'm used to:
Now I want to make this process automatic. Ideally I want to have a script or program that accepts two arguments, the PID of the process and a time interval (e.g 2 seconds). The script/program should then capture the events for that PID during that time interval and store them in a file.
But I haven't being able to find the way to do that. After some research I've arrived to the following conclusions (this is all new stuff for me so please correct me if I'm wrong):
Process Monitoruses the Event Tracing for Windows (ETW) framework to capture the events. In particular it uses theNT Kernel Loggersession which (by default?) traces the events provided by theWindows Kernel Traceprovider.- The ETW framework offers an API, and it is possible to use it by developing a program in C++/C#. This might be an option but it seems quite involved. On the other hand, there are some command line tools that can be used to capture ETW events:
logmanandtracelog.logmancomes by default with windows while to usetracelogyou have to first install Visual Studio, which is not an option for me.
Thus logman seems to be a good option. I tried the following:
C:\Windows\system32>logman start "NT Kernel Logger" -p "Windows Kernel Trace" -ets -nb 16 256 -bs 64 -o C:\trlog.etl -rt
The command completed successfully.

C:\Windows\system32>logman stop "NT Kernel Logger" -ets
The command completed successfully.

C:\Windows\system32>tracerpt C:\trlog.etl -o C:\trlog.xml -of XML -summary C:\trlog-summary.txt -report C:\trlog-report.xml

Input
----------------
File(s):
     C:\trlog.etl

100.00%

Output
----------------
DumpFile:           C:\trlog.xml
Summary:            C:\trlog-summary.txt
Report:             C:\trlog-report.xml

The command completed successfully.

C:\Windows\system32>
But the output of C:\trlog.xml doesn't seem to correspond with the output I expected. I expect a list of events as shown in the picture above, where you can distinguish between registry events and I/O events and threading events. But instead I get a list of events similar to this (I cannot tell what kind of event it is nor which fields corresponds to the fields shown by Process Monitor):
<Event xmlns="http://schemas.microsoft.com/win/2004/08/events/event">
    <System>
        <Provider Guid="{9e814aad-3204-11d2-9a82-006008a86939}" />
        <EventID>0</EventID>
        <Version>3</Version>
        <Level>0</Level>
        <Task>0</Task>
        <Opcode>15</Opcode>
        <Keywords>0x0</Keywords>
        <TimeCreated SystemTime="2021-02-19T11:33:47.360274700+00:59" />
        <Correlation ActivityID="{00000000-0000-0000-0000-000000000000}" />
        <Execution ProcessID="10936" ThreadID="5500" ProcessorID="0" KernelTime="90" UserTime="30" />
        <Channel />
        <Computer />
    </System>
    <EventData>
        <Data Name="ProcessId">0x0</Data>
        <Data Name="ServiceState">0x1</Data>
        <Data Name="SubProcessTag">0x80</Data>
        <Data Name="ServiceName">PNRPsvc</Data>
        <Data Name="DisplayName">Peer Name Resolution Protocol</Data>
        <Data Name="ProcessName"></Data>
        <Data Name="LoadOrderGroup"></Data>
        <Data Name="SvchostGroup"></Data>
    </EventData>
    <RenderingInfo Culture="en-DE">
        <Opcode>Services</Opcode>
        <Provider>MSNT_SystemTrace</Provider>
        <EventName xmlns="http://schemas.microsoft.com/win/2004/08/events/trace">SystemConfig</EventName>
    </RenderingInfo>
    <ExtendedTracingInfo xmlns="http://schemas.microsoft.com/win/2004/08/events/trace">
        <EventGuid>{01853a65-418f-4f36-aefc-dc0f1d2fd235}</EventGuid>
    </ExtendedTracingInfo>
</Event>
My questions are:
- Is
logmanthe right tool for what I'm trying to achieve? Is there a better tool/way to do that? - If
logmanis indeed the right tool, how can I use it? Am I querying the right session/provider. Am I parsing the.etlfile properly by usingtracerpt? Why I don't see the same output, or at least similar output, to whatProcess Monitorshows?
