List of countries by Human Development Index
The United Nations Development Programme (UNDP) ranks countries into four tiers of human development by combining measurements of life expectancy, education, and per-capita income into the Human Development Index (HDI) in its annual Human Development Report.
|
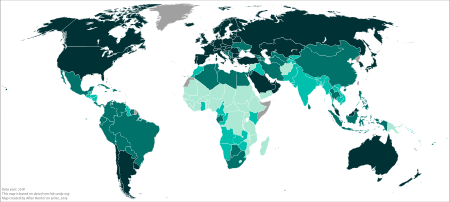
0.800–1.000 (very high)
0.700–0.799 (high)
0.555–0.699 (medium) |
0.350–0.554 (low)
Data unavailable |
.png)
The HDI is a summary index using life expectancy at birth, expected years of schooling for children and mean years of schooling for adults, and GNI per capita. The final HDI is a value between 0 and 1 with countries grouped into four categories depending on the value, very high for HDI of 0.800 and above, high from 0.700 to 0.799, medium from 0.550 to 0.699 and low below 0.550.[1][2]
The Human Development Report has been published most years since 1990. The 2019 report contained the HDI of 189 countries and territories and 15 regions or groups of countries based on data collected in 2018.[3]
In the 2010 Human Development Report, a further Inequality-adjusted Human Development Index (IHDI) was introduced assessing countries on a fourth dimension of inequality. The report stated that while the HDI remains useful, "the IHDI is the actual level of human development (accounting for inequality)" and "the HDI can be viewed as an index of 'potential' human development (or the maximum IHDI that could be achieved if there were no inequality)".[4]
Countries
%2C_score_changes.svg.png)


| Rank | Country or Territory | HDI | |||
|---|---|---|---|---|---|
| 2018 data (2019 report)[5] | Change from previous year[5] | 2018 data (2019 report)[5] | Average annual HDI growth (2010–2018)[6] | ||
| Very high human development | |||||
| 1 | 0.954 | ||||
| 2 | 0.946 | ||||
| 3 | 0.942 | ||||
| 4 | 0.939 | ||||
| 4 | 0.939 | ||||
| 6 | 0.938 | ||||
| 6 | 0.938 | ||||
| 8 | 0.937 | ||||
| 9 | 0.935 | ||||
| 10 | 0.933 | ||||
| 11 | 0.930 | ||||
| 12 | 0.925 | ||||
| 13 | 0.922 | ||||
| 14 | 0.921 | ||||
| 15 | 0.920 | ||||
| 15 | 0.920 | ||||
| 17 | 0.919 | ||||
| 18 | 0.917 | ||||
| 19 | 0.915 | ||||
| 20 | 0.914 | ||||
| 21 | 0.909 | ||||
| 22 | 0.906 | ||||
| 22 | 0.906 | ||||
| 24 | 0.902 | ||||
| 25 | 0.893 | ||||
| 26 | 0.891 | ||||
| 26 | 0.891 | ||||
| 28 | 0.885 | ||||
| 29 | 0.883 | ||||
| 30 | 0.882 | ||||
| 31 | 0.873 | ||||
| 32 | 0.872 | ||||
| 32 | 0.872 | ||||
| 34 | 0.869 | ||||
| 35 | 0.866 | ||||
| 36 | 0.857 | ||||
| 36 | 0.857 | ||||
| 36 | 0.857 | ||||
| 39 | 0.854 | ||||
| 40 | 0.850 | ||||
| 41 | 0.848 | ||||
| 42 | 0.847 | ||||
| 43 | 0.845 | ||||
| 43 | 0.845 | ||||
| 45 | 0.838 | ||||
| 46 | 0.837 | ||||
| 47 | 0.834 | ||||
| 48 | 0.830 | ||||
| 49 | 0.824 | ||||
| 50 | 0.817 | ||||
| 50 | 0.817 | ||||
| 52 | 0.816 | ||||
| 52 | 0.816 | ||||
| 52 | 0.816 | ||||
| 55 | 0.814 | ||||
| 56 | 0.813 | ||||
| 57 | 0.808 | ||||
| 57 | 0.808 | ||||
| 59 | 0.806 | ||||
| 60 | 0.805 | ||||
| 61 | 0.804 | ||||
| 62 | 0.801 | ||||
| High human development | |||||
| 63 | 0.799 | ||||
| 63 | 0.799 | ||||
| 65 | 0.797 | ||||
| 66 | 0.796 | ||||
| 67 | 0.795 | ||||
| 68 | 0.794 | ||||
| 69 | 0.791 | ||||
| 70 | 0.786 | ||||
| 71 | 0.780 | ||||
| 72 | 0.778 | ||||
| 73 | 0.777 | ||||
| 74 | 0.776 | ||||
| 75 | 0.769 | ||||
| 76 | 0.767 | ||||
| 77 | 0.765 | ||||
| 78 | 0.763 | ||||
| 79 | 0.761 | ||||
| 79 | 0.761 | ||||
| 81 | 0.760 | ||||
| 82 | 0.759 | ||||
| 82 | 0.759 | ||||
| 82 | 0.759 | ||||
| 85 | 0.758 | ||||
| 85 | 0.758 | ||||
| 87 | 0.754 | ||||
| 88 | 0.750 | ||||
| 89 | 0.745 | ||||
| 89 | 0.745 | ||||
| 91 | 0.739 | ||||
| 92 | 0.735 | ||||
| — | — | World | 0.731 | ||
| 93 | 0.730 | ||||
| 94 | 0.728 | ||||
| 94 | 0.728 | ||||
| 96 | 0.726 | ||||
| 96 | 0.726 | ||||
| 98 | 0.724 | ||||
| 98 | 0.724 | ||||
| 98 | 0.724 | ||||
| 98 | 0.724 | ||||
| 102 | 0.723 | ||||
| 103 | 0.720 | ||||
| 104 | 0.719 | ||||
| 105 | 0.717 | ||||
| 106 | 0.712 | ||||
| 107 | 0.711 | ||||
| 108 | 0.710 | ||||
| 108 | 0.710 | ||||
| 110 | 0.708 | ||||
| 111 | 0.707 | ||||
| 111 | 0.707 | ||||
| 113 | 0.705 | ||||
| 114 | 0.703 | ||||
| 115 | 0.702 | ||||
| 116 | 0.700 | ||||
| Medium human development | |||||
| 117 | 0.698 | NA[lower-alpha 1] | |||
| 118 | 0.693 | ||||
| 119 | 0.690 | ||||
| 120 | 0.689 | ||||
| 121 | 0.676 | ||||
| 122 | 0.674 | ||||
| 123 | 0.670 | ||||
| 124 | 0.667 | ||||
| 125 | 0.656 | ||||
| 126 | 0.651 | ||||
| 126 | 0.651 | ||||
| 126 | 0.651 | ||||
| 129 | 0.647 | ||||
| 130 | 0.645 | ||||
| 131 | 0.626 | ||||
| 132 | 0.623 | ||||
| 132 | 0.623 | ||||
| 134 | 0.617 | ||||
| 135 | 0.614 | ||||
| 135 | 0.614 | ||||
| 137 | 0.609 | ||||
| 138 | 0.608 | ||||
| 138 | 0.608 | ||||
| 140 | 0.604 | ||||
| 141 | 0.597 | ||||
| 142 | 0.596 | ||||
| 143 | 0.591 | ||||
| 144 | 0.588 | ||||
| 145 | 0.584 | ||||
| 146 | 0.581 | ||||
| 147 | 0.579 | ||||
| 147 | 0.579 | ||||
| 149 | 0.574 | ||||
| 150 | 0.563 | ||||
| 150 | 0.563 | ||||
| 152 | 0.560 | ||||
| 153 | 0.557 | ||||
| Low human development | |||||
| 154 | 0.549 | ||||
| 155 | 0.543 | ||||
| 156 | 0.538 | ||||
| 157 | 0.536 | ||||
| 158 | 0.534 | ||||
| 159 | 0.528 | ||||
| 159 | 0.528 | ||||
| 161 | 0.527 | ||||
| 162 | 0.521 | ||||
| 163 | 0.520 | ||||
| 164 | 0.518 | ||||
| 165 | 0.516 | ||||
| 166 | 0.514 | ||||
| 167 | 0.513 | ||||
| 168 | 0.507 | ||||
| 169 | 0.503 | ||||
| 170 | 0.496 | ||||
| 171 | 0.495 | ||||
| 172 | 0.485 | ||||
| 173 | 0.470 | ||||
| 174 | 0.466 | ||||
| 174 | 0.466 | ||||
| 176 | 0.465 | ||||
| 177 | 0.463 | ||||
| 178 | 0.461 | ||||
| 179 | 0.459 | ||||
| 180 | 0.446 | ||||
| 181 | 0.438 | ||||
| 182 | 0.434 | ||||
| 182 | 0.434 | ||||
| 184 | 0.427 | ||||
| 185 | 0.423 | ||||
| 186 | 0.413 | ||||
| 187 | 0.401 | ||||
| 188 | 0.381 | ||||
| 189 | 0.377 | ||||
Regions and groups
| Region or group | 1990 data[7] | 2000 data[7] | 2010 data[7] | 2013 data[7] | 2015 data[7] | 2016 data[7] | 2017 data[7] | 2018 data[7] |
|---|---|---|---|---|---|---|---|---|
| Very high human development | ||||||||
| OECD | 0.785 | 0.834 | 0.873 | 0.883 | 0.889 | 0.892 | 0.894 | 0.895 |
| Very high human development | 0.779 | 0.823 | 0.866 | 0.878 | 0.886 | 0.888 | 0.890 | 0.892 |
| High human development | ||||||||
| Europe and Central Asia | 0.652 | 0.667 | 0.735 | 0.759 | 0.770 | 0.772 | 0.776 | 0.779 |
| Latin America and the Caribbean | 0.628 | 0.687 | 0.731 | 0.748 | 0.754 | 0.756 | 0.758 | 0.759 |
| High human development | 0.568 | 0.630 | 0.706 | 0.727 | 0.738 | 0.743 | 0.746 | 0.750 |
| East Asia and the Pacific | 0.519 | 0.597 | 0.697 | 0.714 | 0.727 | 0.733 | 0.737 | 0.741 |
| World | 0.598 | 0.641 | 0.697 | 0.713 | 0.722 | 0.727 | 0.729 | 0.731 |
| Small Island Developing States | 0.595 | 0.642 | 0.702 | 0.708 | 0.717 | 0.719 | 0.722 | 0.723 |
| Arab states | 0.556 | 0.613 | 0.676 | 0.688 | 0.695 | 0.699 | 0.701 | 0.703 |
| Medium human development | ||||||||
| Developing countries | 0.516 | 0.571 | 0.642 | 0.663 | 0.674 | 0.680 | 0.683 | 0.686 |
| South Asia | 0.441 | 0.505 | 0.585 | 0.607 | 0.624 | 0.634 | 0.639 | 0.642 |
| Medium human development | 0.436 | 0.497 | 0.575 | 0.599 | 0.616 | 0.625 | 0.630 | 0.634 |
| Low human development | ||||||||
| Sub-Saharan Africa | 0.402 | 0.423 | 0.498 | 0.521 | 0.532 | 0.535 | 0.539 | 0.541 |
| Least developed countries | 0.350 | 0.399 | 0.485 | 0.504 | 0.516 | 0.520 | 0.525 | 0.528 |
| Low human development | 0.352 | 0.386 | 0.473 | 0.490 | 0.499 | 0.501 | 0.505 | 0.507 |
See also
Notes
- Data not available for 2010
References
- "Human Development Index (HDI) | Human Development Reports". hdr.undp.org. United Nations Development Programme. Retrieved 23 February 2020.
- "Human Development Report 2019 – Technical notes" (PDF). hdr.undp.org. United Nations Development Programme. Retrieved 23 February 2020.
- "Human Development Report 2019 Overview" (PDF). United Nations Development Programme. pp. 22–25. Retrieved 9 December 2019.
- Human Development Report 2010 (PDF). New York: United Nations Development Programme. 2010. p. 87. ISBN 9780230284456. Retrieved 23 February 2020.
- Human Development Report 2019 (PDF). New York: United Nations Development Programme. 2019. pp. 300–303. ISBN 978-92-1-126439-5. Retrieved 23 February 2020.
- Human Development Report 2019 (PDF). New York: United Nations Development Programme. 2019. pp. 304–307. ISBN 978-92-1-126439-5. Retrieved 23 February 2020.
- Human Development Report 2019 (PDF). New York: United Nations Development Programme. 2019. p. 307. ISBN 978-92-1-126439-5. Retrieved 23 February 2020.
External links
Deprivation and poverty indicators | |||||
|---|---|---|---|---|---|
| Social |
| ||||
| Psychological |
| ||||
| Economic |
| ||||
| Physical |
| ||||
| Complex measures |
| ||||
| Gender |
| ||||
| Other | |||||
| |||||