Human Development Index
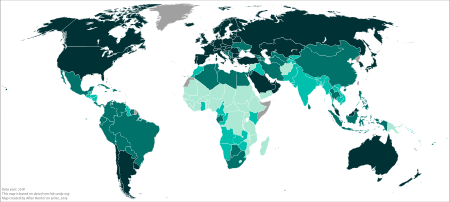
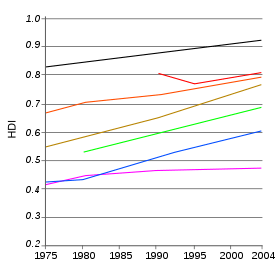
The Human Development Index (HDI) is a statistic composite index of life expectancy, education (Literacy Rate, Gross Enrollment Ratio at different levels and Net Attendance Ratio) , and per capita income indicators, which are used to rank countries into four tiers of human development. A country scores a higher HDI when the lifespan is higher, the education level is higher, and the gross national income GNI (PPP) per capita is higher. It was developed by Pakistani economist Mahbub ul Haq and was further used to measure a country's development by the United Nations Development Programme (UNDP)'s Human Development Report Office.[1][2][3]
|
0.800–1.000 (very high)
0.700–0.799 (high)
0.550–0.699 (medium) |
0.350–0.549 (low)
Data unavailable |
.png)
|
≥ 0.900
0.850–0.899
0.800–0.849
0.750–0.799
0.700–0.749 |
0.650–0.699
0.600–0.649
0.550–0.599
0.500–0.549
0.450–0.499 |
0.400–0.449
≤ 0.399
Data unavailable |
The 2010 Human Development Report introduced an Inequality-adjusted Human Development Index (IHDI). While the simple HDI remains useful, it stated that "the IHDI is the actual level of human development (accounting for inequality)", and "the HDI can be viewed as an index of 'potential' human development (or the maximum IHDI that could be achieved if there were no inequality)". The index does not take into account several factors, such as the net wealth per capita or the relative quality of goods in a country. This situation tends to lower the ranking for some of the most advanced countries, such as the G7 members and others.[4]
The index is based on the human development approach, developed by Mahbub ul Haq, often framed in terms of whether people are able to "be" and "do" desirable things in life. Examples include—Being: well fed, sheltered, healthy; Doing: work, education, voting, participating in community life. The freedom of choice is central—someone choosing to be hungry (as during a religious fast) is quite different from someone who is hungry because they cannot afford to buy food, or because the country is in a famine.[5]
Origins
.jpg)
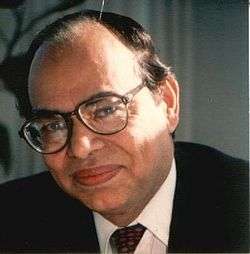
The origins of the HDI are found in the annual Human Development Reports produced by the Human Development Report Office of the United Nations Development Programme (UNDP). These were devised and launched by Pakistani economist Mahbub ul Haq in 1990, and had the explicit purpose "to shift the focus of development economics from national income accounting to people-centered policies". To produce the Human Development Reports, Mahbub ul Haq formed a group of development economists including Paul Streeten, Frances Stewart, Gustav Ranis, Keith Griffin, Sudhir Anand, and Meghnad Desai. Nobel laureate Amartya Sen utilized Haq's work in his own work on human capabilities.[3] Haq believed that a simple composite measure of human development was needed to convince the public, academics, and politicians that they can and should evaluate development not only by economic advances but also improvements in human well-being.
Dimensions and calculation
New method (2010 Index onwards)
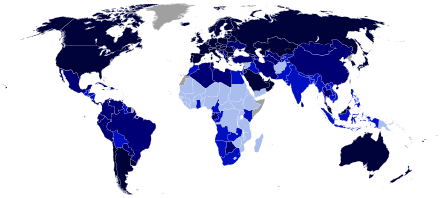
|
0.800–1.000 (very high)
0.700–0.799 (high)
0.550–0.699 (medium) |
0.350–0.549 (low)
Data unavailable |
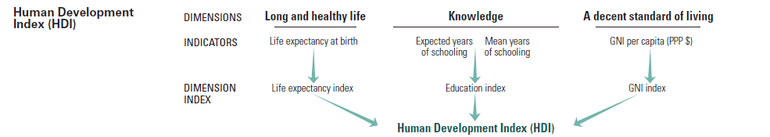
Published on 4 November 2010 (and updated on 10 June 2011), the 2010 Human Development Report calculated the HDI combining three dimensions:[7][8]
- A long and healthy life: Life expectancy at birth
- Education index: Mean years of schooling and Expected years of schooling
- A decent standard of living: GNI per capita (PPP international dollars)
In its 2010 Human Development Report, the UNDP began using a new method of calculating the HDI. The following three indices are used:
1. Life Expectancy Index (LEI)

- LEI is 1 when Life expectancy at birth is 85 and 0 when Life expectancy at birth is 20.
2. Education Index (EI) [9]

- 2.1 Mean Years of Schooling Index (MYSI) [10]
- Fifteen is the projected maximum of this indicator for 2025.
- 2.2 Expected Years of Schooling Index (EYSI) [11]
- Eighteen is equivalent to achieving a master's degree in most countries.


3. Income Index (II)

- II is 1 when GNI per capita is $75,000 and 0 when GNI per capita is $100.
Finally, the HDI is the geometric mean of the previous three normalized indices:

LE: Life expectancy at birth
MYS: Mean years of schooling (i.e. years that a person aged 25 or older has spent in formal education)
EYS: Expected years of schooling (i.e. total expected years of schooling for children under 18 years of age)
GNIpc: Gross national income at purchasing power parity per capita
Old method (before 2010 Index)
The HDI combined three dimensions last used in its 2009 Report:
- Life expectancy at birth, as an index of population health and longevity to HDI
- Knowledge and education, as measured by the adult literacy rate (with two-thirds weighting) and the combined primary, secondary, and tertiary gross enrollment ratio (with one-third weighting).
- Standard of living, as indicated by the natural logarithm of gross domestic product per capita at purchasing power parity.
This methodology was used by the UNDP until their 2011 report.
The formula defining the HDI is promulgated by the United Nations Development Programme (UNDP).[12] In general, to transform a raw variable, say , into a unit-free index between 0 and 1 (which allows different indices to be added together), the following formula is used:


where and are the lowest and highest values the variable can attain, respectively.


The Human Development Index (HDI) then represents the uniformly weighted sum with 1⁄3 contributed by each of the following factor indices:
- Life Expectancy Index =
- Education Index =
- Adult Literacy Index (ALI) =
- Gross Enrollment Index (GEI) =
- GDP =


Other organizations/companies may include other factors, such as infant mortality, which produces a different HDI.
2018 Human Development Index (2019 report)
The Human Development Report 2019 by the United Nations Development Programme was released on 9 December 2019, and calculates HDI values based on data collected in 2018.[13] Below is the list of countries or territories with ’very high human development’:


|
| ||||||||||||||||||||||||||||||||||||||||||||||||||||||||||||||||||||||||||||||||||||||||||||||||||||||||||||||||||||||||||||||||||||||||||||||||||||||||||||||||||||||||||||||||||||||||||||||||||||||||||||||||||||||||||||||||||||||||||||||||||||||||||||||||||||||||||||||||||||||||||||||||||||||||||||||||||||||||||||||||||||||||
Inequality-adjusted HDI (2019 report)
The Inequality-adjusted Human Development Index (IHDI)[13] is a "measure of the average level of human development of people in a society once inequality is taken into account".
The rankings are not relative to the HDI list above due to the exclusion of countries which are missing IHDI data.


.svg.png)


.svg.png)


.svg.png)


Countries with ’very high human development’ with a missing IHDI: Liechtenstein, United Arab Emirates, Andorra, Saudi Arabia, Qatar, Brunei, Bahrain, Palau, Kuwait, Bahamas, Malaysia and Seychelles.
Past top countries
The list below displays the top-ranked country from each year of the Human Development Index. Norway has been ranked the highest fourteen times, Canada eight times, and Japan three times. Iceland has been ranked highest twice.
In each original HDI
The year represents the time period from which the statistics for the index were derived. In parentheses is the year when the report was published.
- 2018 (2019):
- 2017 (2018):
- 2015 (2016):
- 2014 (2015):
- 2013 (2014):
- 2012 (2013):
- 2011 (2011):
- 2010 (2010):
- 2007 (2009):
- 2006 (2008):
- 2005 (2007):
- 2004 (2006):
- 2003 (2005):
- 2002 (2004):
- 2001 (2003):
- 2000 (2002):
- 1999 (2001):
- 1998 (2000):
- 1997 (1999):
- 1995 (1998):
- 1994 (1997):
- 1993 (1996):
- 1992 (1995):
- ???? (1994):
- ???? (1993):
- 1990 (1992):
- 1990 (1991):
Geographical coverage
The HDI has extended its geographical coverage: David Hastings, of the United Nations Economic and Social Commission for Asia and the Pacific, published a report geographically extending the HDI to 230+ economies, whereas the UNDP HDI for 2009 enumerates 182 economies and coverage for the 2010 HDI dropped to 169 countries.[14][15]
Country/region specific HDI lists
- African countries
- Argentine provinces
- Australian states
- Bolivian departments
- Brazilian states
- Canadian provinces and territories
- Chilean regions
- Chinese administrative divisions
- Ethiopian regions
- European countries
- German states
- Indian states
- Indonesian provinces
- Iranian provinces
- Iraqi governorates
- Italian regions
- Japanese prefectures
- Latin American countries
- Mexican states
- Pakistani administrative units
- Philippine provinces
- Russian federal subjects
- South African provinces
- Spanish communities
- UK countries and regions of England
- U.S. states (American Human Development Report (AHDR))
- Venezuelan states
- World, regional (Sub-national HDI by GDL)
Criticism
The Human Development Index has been criticized on a number of grounds, including alleged lack of consideration of technological development or contributions to the human civilization, focusing exclusively on national performance and ranking, lack of attention to development from a global perspective, measurement error of the underlying statistics, and on the UNDP's changes in formula which can lead to severe misclassification in the categorisation of "low", "medium", "high" or "very high" human development countries.[16]
Sources of data error
Economists Hendrik Wolff, Howard Chong and Maximilian Auffhammer discuss the HDI from the perspective of data error in the underlying health, education and income statistics used to construct the HDI. They identified three sources of data error which are due to (i) data updating, (ii) formula revisions and (iii) thresholds to classify a country's development status and conclude that 11%, 21% and 34% of all countries can be interpreted as currently misclassified in the development bins due to the three sources of data error, respectively. The authors suggest that the United Nations should discontinue the practice of classifying countries into development bins because: the cut-off values seem arbitrary, can provide incentives for strategic behavior in reporting official statistics, and have the potential to misguide politicians, investors, charity donors and the public who use the HDI at large.[16]
In 2010, the UNDP reacted to the criticism and updated the thresholds to classify nations as low, medium, and high human development countries. In a comment to The Economist in early January 2011, the Human Development Report Office responded[17] to a 6 January 2011 article in the magazine[18] which discusses the Wolff et al. paper. The Human Development Report Office states that they undertook a systematic revision of the methods used for the calculation of the HDI, and that the new methodology directly addresses the critique by Wolff et al. in that it generates a system for continuously updating the human-development categories whenever formula or data revisions take place.
In 2013, Salvatore Monni and Alessandro Spaventa emphasized that in the debate of GDP versus HDI, it is often forgotten that these are both external indicators that prioritize different benchmarks upon which the quantification of societal welfare can be predicated. The larger question is whether it is possible to shift the focus of policy from a battle between competing paradigms to a mechanism for eliciting information on well-being directly from the population.[19]
See also
Indices
- Bhutan GNH Index
- Broad measures of economic progress
- Democracy Index
- Fragile States Index
- Gross domestic product
- Green national product
- Green gross domestic product (Green GDP)
- Gender Inequality Index
- Gender-related Development Index
- Genuine Progress Indicator (GPI)
- Global Peace Index (GPI)
- Gross National Well-being (GNW)
- Happy Planet Index (HPI)
- Human Poverty Index
- Inequality-adjusted Human Development Index (IHDI)
- Legatum Prosperity Index
- List of countries by Human Development Index
- Living planet index
- Multidimensional Poverty Index
- Rule of Law Index
- OECD Better Life Index (BLI)
- Social Progress Index
- Where-to-be-born Index
- World Happiness Report
Other
- Developing country
- Economic development
- Ethics of care
- Happiness economics
- Human Development and Capability Association
- International development
- List of countries by percentage of population living in poverty
- Right to an adequate standard of living
- Subjective life satisfaction
- Sustainable Development Goals (SDGs)
References
- A. Stanton, Elizabeth (February 2007). "The Human Development Index: A History". PERI Working Papers: 14–15. Archived from the original on 28 February 2019. Retrieved 28 February 2019.
- "Human Development Index". Economic Times. Archived from the original on 1 December 2017. Retrieved 29 November 2017.
- "The Human Development concept". UNDP. 2010. Archived from the original on 15 April 2012. Retrieved 29 July 2011.
- The Courier. Commission of the European Communities. 1994.
- "What is Human Development". UNDP. 2017. Archived from the original on 27 October 2017. Retrieved 27 October 2017.
... human development approach, developed by the economist Mahbub Ul Haq ...'
- "Table 2. Human Development Index Trends, 1990-2017". HDRO (Human Development Report Office) United Nations Development Programme. Archived (PDF) from the original on 22 March 2017. Retrieved 14 September 2018.
- "Human Development Report 2010". UNDP. 4 November 2010. Archived from the original on 22 December 2015. Retrieved 15 December 2015.
- "Technical notes" (PDF). UNDP. 2013. Archived (PDF) from the original on 16 June 2015. Retrieved 15 December 2015.
- "New method of calculation of Human Development Index (HDI)". India Study Channel. 1 June 2011. Archived from the original on 10 November 2017. Retrieved 19 November 2017.
- Mean years of schooling (of adults) (years) is a calculation of the average number of years of education received by people ages 25 and older in their lifetime based on education attainment levels of the population converted into years of schooling based on theoretical duration of each level of education attended. Source: Barro, R. J.; Lee, J.-W. (2010). "A New Data Set of Educational Attainment in the World, 1950–2010". NBER Working Paper No. 15902. doi:10.3386/w15902. Archived from the original on 7 August 2011. Retrieved 29 July 2011.
- (ESYI is a calculation of the number of years a child is expected to attend school, or university, including the years spent on repetition. It is the sum of the age-specific enrollment ratios for primary, secondary, post-secondary non-tertiary and tertiary education and is calculated assuming the prevailing patterns of age-specific enrollment rates were to stay the same throughout the child's life. Expected years of schooling is capped at 18 years. (Source: UNESCO Institute for Statistics (2010). Correspondence on education indicators. March. Montreal.)
- "Definition, Calculator, etc. at UNDP site". Archived from the original on 20 December 2007. Retrieved 26 May 2020.
- "Human Development Report 2019 – "Beyond income, beyond averages, beyond today: Inequalities in human development in the 21st century"" (PDF). HDRO (Human Development Report Office) United Nations Development Programme. pp. 22–25. Retrieved 9 December 2019.
- Hastings, David A. (2009). "Filling Gaps in the Human Development Index". United Nations Economic and Social Commission for Asia and the Pacific, Working Paper WP/09/02. Archived from the original on 30 April 2011. Retrieved 1 December 2009.
- Hastings, David A. (2011). "A "Classic" Human Development Index with 232 Countries". HumanSecurityIndex.org. Archived from the original on 3 May 2011. Retrieved 9 March 2011. Information Note linked to data
- Wolff, Hendrik; Chong, Howard; Auffhammer, Maximilian (2011). "Classification, Detection and Consequences of Data Error: Evidence from the Human Development Index". Economic Journal. 121 (553): 843–870. doi:10.1111/j.1468-0297.2010.02408.x.
- "UNDP Human Development Report Office's comments". The Economist. January 2011. Archived from the original on 11 February 2011. Retrieved 12 January 2011.
- "The Economist (pages 60–61 in the issue of Jan 8, 2011)". 6 January 2011. Archived from the original on 13 January 2011. Retrieved 12 January 2011.
- Monni, Salvatore; Spaventa, Alessandro (2013). "Beyond Gdp and HDI: Shifting the focus from Paradigms to Politics". Development. 56 (2): 227–231. doi:10.1057/dev.2013.30.
External links
| Wikimedia Commons has media related to Human Development Index. |
- Human Development Index
- Human Development Tools and Rankings
- "Technical note explaining the definition of the HDI" (PDF). Archived from the original (PDF) on 16 February 2008. (5.54 MB)
- New demographic datasets by 'Human Development Index (HDI)’
- An independent HDI covering 232 countries, formulated along the lines of the traditional (pre-2010) approach.
Deprivation and poverty indicators | |||||
|---|---|---|---|---|---|
| Social |
| ||||
| Psychological |
| ||||
| Economic |
| ||||
| Physical |
| ||||
| Complex measures |
| ||||
| Gender |
| ||||
| Other | |||||
| |||||
| Authority control |
|
|---|