Timeline of the 2017 Atlantic hurricane season
The 2017 Atlantic hurricane season was an event in the annual tropical cyclone season in the north Atlantic Ocean. This Atlantic hurricane season saw above-normal activity;[nb 1] it was the seventh most active season on record and the most active since 2005.[2] The season officially began on June 1, 2017 and ended on November 30, 2017. These dates, adopted by convention, historically describe the period in each year when most tropical systems form.[3] However, storm formation is possible at any time of the year, as demonstrated in 2017 by the formation of the season's first named storm, Tropical Storm Arlene, on April 19. The final storm of the season, Tropical Storm Rina degenerated to a remnant area of low pressure on November 9.
| Timeline of the 2017 Atlantic hurricane season | |||||
|---|---|---|---|---|---|
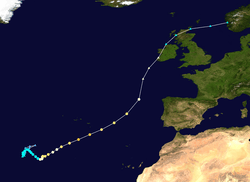
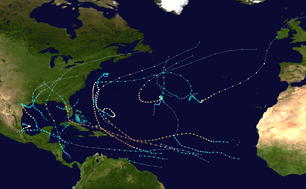 Season summary map | |||||
| Season boundaries | |||||
| First system formed | April 19, 2017 | ||||
| Last system dissipated | November 9, 2017 | ||||
| Strongest system | |||||
| Name | Maria | ||||
| Maximum winds | 175 mph (280 km/h) (1-minute sustained) | ||||
| Lowest pressure | 908 mbar (hPa; 26.81 inHg) | ||||
| Longest lasting system | |||||
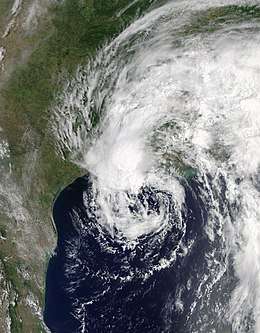
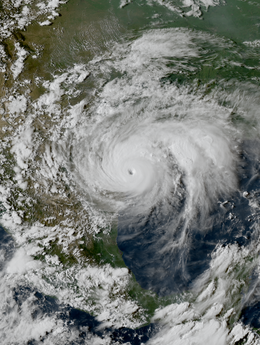
| Name | Harvey | ||||
| Duration | 14.75 days | ||||
| |||||
The 2017 season produced 17 named storms, of which 10 became hurricanes including six of which intensified into major hurricanes (Category 3, 4 or 5). Of those six, Harvey and Irma, became the first major hurricanes to make landfall on the continental United States in 12 years;[2] a third hurricane, Nate, did so as well. September was both the most active month in the season and the most active month for Atlantic hurricanes ever recorded. Four long-lived major hurricanes—Irma, Jose, Lee and Maria—moved through the Atlantic Basin, as did the short-lived Hurricane Katia. Overall, more accumulated cyclone energy was generated during September 2017 than during the entire 2016 season.[4]
This timeline documents tropical cyclone formations, strengthening, weakening, landfalls, extratropical transitions, and dissipations during the season. It includes information that was not released throughout the season, meaning that data from post-storm reviews by the National Hurricane Center, such as a storm that was not initially warned upon, has been included.
By convention, meteorologists one time zone when issuing forecasts and making observations: Coordinated Universal Time (UTC), and also use the 24-hour clock (where 00:00 = midnight UTC).[5] In this time line, all information is listed by UTC first with the respective local time included in parentheses.
Timeline

April
April 19
- 00:00 UTC (11:00 p.m. AST April 18) at 31.1°N 42.6°W – Subtropical Depression One develops from an area of low pressure about 980 miles (1,575 km)[nb 2] west-southwest of the Azores.[6]

April 20
- 00:00 UTC (11:00 p.m. AST April 19) at 32.8°N 39.6°W – Subtropical Depression One transitions into Tropical Depression One roughly 650 miles (1,045 km) southwest of the Azores.[6]
- 06:00 UTC (2:00 a.m. AST) at 33.8°N 39.2°W – Tropical Depression One intensifies into Tropical Storm Arlene approximately 585 miles (940 km) southwest of the Azores.[6]
April 21
- 00:00 UTC (8:00 p.m. AST April 20) at 39.0°N 43.0°W – Tropical Storm Arlene attains its peak intensity with maximum sustained winds of 50 mph (85 km/h) and a minimum barometric pressure of 990 mbar (hPa; 29.23 inHg) about 635 miles (1,020 km) west of the Azores.[6]
- 12:00 UTC (8:00 a.m. AST) at 39.9°N 49.3°W – Tropical Storm Arlene transitions into an extratropical cyclone roughly 965 miles (1,555 km) west of the Azores.[6]
May
- No tropical cyclones form in the Atlantic Ocean during the month of May
June
June 1
- The 2017 Atlantic hurricane season officially begins.[3]
June 18
- 21:00 UTC (5:00 p.m. AST) at 7.5°N 50.4°W – Potential Tropical Cyclone Two develops about 815 miles (1,310 km) east-southeast of the Windward Islands.[7]
June 19
- 18:00 UTC (2:00 p.m. AST) at 9.2°N 58.9°W – Potential Tropical Cyclone Two organizes into Tropical Storm Bret and attains a minimum barometric pressure of 1007 mbar (hPa; 29.74 inHg) roughly 185 miles (300 km) east-southeast of Trinidad.[8]
- 2100 UTC (4:00 p.m. CDT) at 24.7°N 88.7°W – Potential Tropical Cyclone Three develops in the Gulf of Mexico about 305 miles (490 km) south of the mouth of the Mississippi River.[9]

June 20
- 02:00 UTC (10:00 p.m. AST) at 10.1°N 61.1°W – Tropical Storm Bret attains peak winds of 50 mph (85 km/h) and makes landfall in southwestern Trinidad.[8]
- 09:00 UTC (5:00 a.m. AST) at 10.6°N 62.6°W – Tropical Storm Bret makes another landfall on the Paria Peninsula of Venezuela, with winds of 50 mph (85 km/h).[8]
- 12:00 UTC (8:00 a.m. AST) at 11.1°N 63.6°W – Tropical Storm Bret becomes disorganized while losing its closed circulation in the southeastern Caribbean Sea, roughly 20 mi (35 km) east-northeast of Ilsa Margarita.[8][10]
- 18:00 UTC (1:00 p.m. CDT) at 25.6°N 90.6°W – Potential Tropical Cyclone Three develops into Tropical Storm Cindy roughly 240 miles (385 km) south-southwest of the mouth of the Mississippi River.[11]
June 21
- 00:00 UTC (7:00 p.m. CDT June 20) at 26.2°N 90.9°W – Tropical Storm Cindy attains peak winds of 60 mph (95 km/h).[11]
June 22
- 06:00 UTC (1:00 a.m. CDT) at 29.4°N 93.6°W – Tropical Storm Cindy attains a minimum barometric pressure of 991 mbar (hPa; 29.27 inHg).[11]
- 07:00 UTC (2:00 a.m. CDT) at 29.8°N 93.7°W – Tropical Storm Cindy makes landfall just east of the Sabine Pass in Louisiana, with winds of 50 mph (85 km/h).[11]
June 23
- 00:00 UTC (7:00 p.m. CDT June 22) at 32.8°N 93.6°W – Tropical Storm Cindy weakens to a tropical depression.[11]
- 18:00 UTC (1:00 p.m. CDT) at 36.7°N 88.1°W – Tropical Depression Cindy degenerates to a remnant area of low pressure about 35 mi (55 km) west of Hopkinsville, Kentucky.[11]
July
July 5
- 18:00 UTC (2:00 p.m. AST) at 12.0°N 37.1°W – Tropical Depression Four develops from an area of low pressure and attains peak winds of 30 mph (45 km/h) about 860 miles (1,385 km) west-southwest of Cabo Verde.[12]
July 6
- 12:00 UTC (8:00 a.m. AST) at 13.3°N 42.2°W – Tropical Depression Four attains a minimum barometric pressure of 1009 mbar (hPa; 29.80 inHg).[12]
July 7
- 15:00 UTC (11:00 a.m. AST) at 15.6°N 50.9°W – Tropical Depression Four, located about 690 mi (1115 km) east of the Lesser Antilles in the central Atlantic, is forecast to degenerate into a into a tropical wave; by 18:00 UTC (2:00 p.m. AST) most of the convection had weakened.[12][13]

July 17
- 06:00 UTC (2:00 a.m. AST) at 10.4°N 49.1°W – A tropical depression develops from an area of low pressure roughly 725 miles (1,165 km) east-southeast of Barbados.[14]
- 12:00 UTC (8:00 a.m. AST) at 10.7°N 50.6°W – The tropical depression intensifies into Tropical Storm Don approximately 625 miles (1,005 km) east-southeast of Barbados.[14]
July 18
- 00:00 UTC (8:00 p.m. AST July 17) at 11.2°N 53.8°W – Tropical Storm Don attains its peak intensity about 405 mi (650 km) east=southeast of Barbados with maximum sustained winds of 50 mph (85 km/h) and a minimum barometric pressure of 1005 mbar (hPa; 29.68 inHg).[14][15]
- 18:00 UTC (2:00 p.m. AST) at 11.5°N 58.7°W – Tropical Storm Don dissipates into a tropical wave about 130 mi (210 km) south-southeast of Barbados..[14][16]

July 31
- 10:00 UTC (6:00 a.m. EDT) at 27.7°N 83.5°W – Tropical Depression Six develops roughly 65 miles (105 km) west-southwest of Tampa, Florida.[17]
- 12:00 UTC (8:00 a.m. EDT) at 27.7°N 83.2°W – Tropical Depression Six intensifies to become Tropical Storm Emily about 45 miles (75 km) west-southwest of Tampa, Florida.[18]
- 14:45 UTC (10:45 a.m. EDT) at 27.5°N 82.7°W – Tropical Storm Emily reaches its peak intensity with winds of 45 mph (75 km/h) and a minimum pressure of 1005 mbar (hPa; 29.68 inHg), and simultaneously makes landfall over Anna Maria Island approximately 10 miles (20 km) northwest of Bradenton, Florida.[19][20]
- 21:00 UTC (5:00 p.m. EDT) at 27.8°N 81.7°W – Tropical Storm Emily weakens to a tropical depression roughly 30 miles (45 km) northwest of Sebring, Florida.[21]
August
August 2
- 03:00 UTC (11:00 p.m. EDT August 1) at 30.9°N 78.0°W – Tropical Depression Emily degenerates to a post-tropical cyclone about 235 miles (375 km) northeast of Cape Canaveral, Florida.[22]
August 6
- 21:00 UTC (5:00 p.m. EDT) at 15.6°N 82.0°W – Potential Tropical Cyclone Seven develops about 90 miles (145 km) east-northeast of Cabo Gracias a Dios.[23]
August 7
- 03:00 UTC (11:00 p.m. EDT August 6) at 16.4°N 83.0°W – Potential Tropical Cyclone Seven intensifies and becomes Tropical Storm Franklin about 100 miles (155 km) north of Cabo Gracias a Dios.[24]

August 8
- 04:00 UTC (11:00 p.m. EDT August 7) at 19.1°N 87.5°W – Tropical Storm Franklin makes landfall near Pulticub, Quintana Roo, with winds of 60 mph (95 km/h) just 25 miles (45 km) north-northeast of Puerto Costa Maya.[25]
August 9
- 00:00 UTC (7:00 p.m. CDT August 8) at 20.3°N 90.9°W – Tropical Storm Franklin emerges over the Gulf of Campeche about 40 mi (60 km) northwest of Campeche City, Campeche.[26]
- 21:00 UTC (4:00 p.m. CDT) at 20.1°N 94.9°W – Tropical Storm Franklin intensifies into a Category 1 hurricane, the first hurricane of the 2017 season, about 175 miles (280 km) east-southeast of Tuxpan, Veracruz.[27]
August 10
- 00:00 UTC (7:00 p.m. CDT August 9) at 20.2°N 95.4°W – Hurricane Franklin attains its peak intensity with maximum sustained winds of 85 mph (140 km/h) and a minimum barometric pressure of 983 mbar (hPa; 29.03 inHg) roughly 135 miles (220 km) east-southeast of Tuxpan, Veracruz.[28]
- 06:00 UTC (1:00 a.m. CDT) at 20.0°N 96.7°W – Hurricane Franklin makes landfall about 80 mi (130 km) southeast of Tuxpan, Veracruz, with sustained winds of 85 mph (140 km/h) and minimum central pressure of 988 mbar (hPa; 29.18 inHg).[29]
- 09:00 UTC (4:00 a.m. CDT) at 19.9°N 97.6°W – Hurricane Franklin weakens to a tropical storm approximately 75 miles (120 km) south of Tuxpan, Veracruz.[30]
- 15:00 UTC (10:00 a.m. CDT) at 19.7°N 99.2°W – Tropical Storm Franklin dissipates about 20 miles (35 km) north-northwest of Mexico City.[31]
August 13
- 03:00 UTC (11:00 p.m. EDT August 12) at 25.3°N 70.3°W – Tropical Depression Eight develops from an area of low pressure roughly 260 miles (415 km) northeast of the southeastern Bahamas.[32]
- 21:00 UTC (5:00 p.m. EDT) at 28.1°N 71.7°W – Tropical Depression Eight intensifies into Tropical Storm Gert approximately 505 miles (810 km) west-southwest of Bermuda.[33]
August 15
- 03:00 UTC (11:00 p.m. EDT August 14) at 31.2°N 72.3°W – Tropical Storm Gert intensifies into a Category 1 hurricane approximately 445 miles (720 km) west of Bermuda.[34]
August 16
- 21:00 UTC (5:00 p.m. AST) at 38.7°N 62.4°W – Hurricane Gert intensifies into a Category 2 hurricane about 410 miles (665 km) south of Halifax, Nova Scotia.[35]
August 17
- 03:00 UTC (11:00 p.m. AST August 16) at 40.1°N 58.4°W – Hurricane Gert attains its peak intensity with maximum sustained winds of 110 mph (165 km/h) and a minimum barometric pressure of 967 mbar (hPa; 28.56 inHg) roughly 410 miles (655 km) southeast of Halifax, Nova Scotia.[36]
- 15:00 UTC (11:00 a.m. AST) at 43.2°N 50.0°W – Hurricane Gert weakens to a Category 1 hurricane approximately 685 miles (1,100 km) east of Halifax, Nova Scotia.[37]
- 15:00 UTC (11:00 a.m. AST) at 13.1°N 55.1°W – Potential Tropical Cyclone Nine develops from an area of low pressure roughly 295 miles (475 km) east of Barbados.[38]
- 21:00 UTC (5:00 p.m. AST) at 44.8°N 46.0°W – Hurricane Gert transitions into a post-tropical cyclone about 860 miles (1,390 km) east of Halifax, Nova Scotia.[39]
- 21:00 UTC (5:00 p.m. AST) at 13.0°N 55.8°W – Potential Tropical Cyclone Nine organizes into Tropical Storm Harvey roughly 250 miles (400 km) east of Barbados.[40]
August 19
- 21:00 UTC (5:00 p.m. EDT) at 14.1°N 70.0°W – Tropical Storm Harvey weakens to a tropical depression approximately 140 miles (225 km) north-northwest of Curaçao in the Lesser Antilles.[41]
August 20
- 03:00 UTC (11:00 p.m. EDT August 19) at 14.3°N 71.8°W – Tropical Depression Harvey degenerates to a tropical wave about 135 miles (215 km) north of the northern tip of the Guajira Peninsula in Colombia.[42]
August 23
- 15:00 UTC (10:00 a.m. CDT) at 21.5°N 92.5°W – The remnants of Harvey regenerate into a tropical depression roughly 535 miles (860 km) south-southeast of Port O'Connor, Texas.[43]
August 24
- 04:00 UTC (11:00 p.m. CDT August 23) at 22.0°N 92.6°W – Tropical Depression Harvey intensifies into a tropical storm approximately 500 miles (810 km) south-southeast of Port O'Connor, Texas.[44]
- 17:00 UTC (12:00 p.m. CDT) at 24.3°N 93.5°W – Tropical Storm Harvey intensifies into a Category 1 hurricane about 340 miles (550 km) southeast of Corpus Christi, Texas.[45]
August 25
- 05:00 UTC (12:00 a.m. CDT) at 25.5°N 94.9°W – Hurricane Harvey intensifies into a Category 2 hurricane roughly 220 miles (355 km) southeast of Corpus Christi, Texas.[46]
- 19:00 UTC (2:00 p.m. CDT) at 27.2°N 96.4°W – Hurricane Harvey intensifies into a Category 3 hurricane approximately 75 miles (120 km) east-southeast of Corpus Christi, Texas.[47]
- 23:00 UTC (6:00 p.m. CDT) at 27.7°N 96.7°W – Hurricane Harvey intensifies into a Category 4 hurricane about 45 miles (70 km) east of Corpus Christi, Texas.[48]
August 26
- 03:00 UTC (10:00 p.m. CDT August 25) at 28.0°N 97.0°W – Hurricane Harvey attains its peak intensity with maximum sustained winds of 130 mph (215 km/h) and a minimum barometric pressure of 938 mbar (hPa; 27.70 inHg) while simultaneously making initial landfall between Port Aransas and Port O'Connor, Texas.[49]
- 06:00 UTC (1:00 a.m. CDT) at 28.2°N 97.0°W – Hurricane Harvey weakens to a Category 3 hurricane and makes its second landfall on the northeastern shore of Copano Bay, about 5 mi (10 km) north of Rockport, Texas, with winds of 125 mph (205 km/h).[50]
- 08:00 UTC (3:00 a.m. CDT) at 28.4°N 97.2°W – Hurricane Harvey weakens to a Category 2 hurricane about 25 miles (40 km) north-northwest of Rockport, Texas.[51]
- 11:00 UTC (6:00 a.m. CDT) at 28.6°N 97.2°W – Hurricane Harvey weakens to a Category 1 hurricane roughly 25 miles (40 km) southwest of Victoria, Texas.[52]
- 18:00 UTC (1:00 p.m. CDT) at 29.1°N 97.6°W – Hurricane Harvey weakens to a tropical storm approximately 60 miles (95 km) east-southeast of San Antonio, Texas.[53]
August 27
- 18:00 UTC (2:00 p.m. EDT) at 30.7°N 80.7°W – Potential Tropical Cyclone Ten develops from an area of low pressure roughly 95 miles (155 km) south-southeast of Savannah, Georgia.[54]
August 28
- 06:00 UTC (2:00 a.m. EDT) at 31.0°N 80.5°W – Potential Tropical Cyclone Ten, attains its peak intensity roughly 185 mi (295 km) south-southwest of Charleston, South Carolina, with maximum sustained winds of 40 mph (65 km/h) and a minimum barometric pressure of 1006 mbar (hPa; 29.71 inHg).[54][55]
- 12:00 UTC (7:00 a.m. EDT) at 28.6°N 96.1°W – Tropical Storm Harvey emerges into Gulf of Mexico about 25 mi (40 km) northeast of Port O'Connor, Texas with maximum sustained winds of 40 mph (65 km/h).[56]
August 29
- 18:00 UTC (2:00 p.m. EDT) at 35.4°N 75.5°W – Potential Tropical Cyclone Ten transitions into an extratropical cyclone about 10 miles (15 km) north of Cape Hatteras, North Carolina.[54]
August 30
- 00:00 UTC (8:00 p.m. AST August 29) at 16.1°N 26.9°W – A tropical depression develops from an area of low pressure about 140 miles (220 km) west-southwest of São Vicente, Cape Verde.[57]
- 06:00 UTC (2:00 a.m. AST) at 16.2°N 28.3°W – The tropical depression intensifies into Tropical Storm Irma roughly 215 miles (345 km) west-southwest of São Vicente, Cape Verde.[57]
- 09:00 UTC (4:00 a.m. CDT) at 29.8°N 93.4°W – Tropical Storm Harvey makes its third and final landfall about 5 miles (10 km) west of Cameron, Louisiana, with winds of 45 mph (75 km/h).[58]
August 31
- 00:00 UTC (7:00 p.m. CDT August 30) at 31.2°N 92.6°W – Tropical Storm Harvey weakens to a tropical depression roughly 10 miles (15 km) southwest of Alexandria, Louisiana.[59]
- 06:00 UTC (2:00 a.m. AST) at 16.4°N 32.5°W – Tropical Storm Irma intensifies into a Category 1 hurricane about 490 miles (790 km) west of São Vicente, Cape Verde.[57]
- 15:00 UTC (11:00 a.m. AST) at 16.9°N 33.8°W – Hurricane Irma intensifies into a Category 2 hurricane roughly 650 miles (1050 km) west of the Cabo Verde Islands.[57]
- 21:00 UTC (5:00 p.m. AST) at 17.3°N 34.8°W – Hurricane Irma intensifies into a Category 3 hurricane about 665 miles (1,070 km) west of São Vicente, Cape Verde.[60]
September
September 1
- 03:00 UTC (10:00 p.m. CDT August 31) at 34.3°N 89.0°W – Tropical Depression Harvey begins to lose its tropical characteristics, transitioning into a post-tropical cyclone approximately 10 mi (15 km) west-southwest of Tupelo, Mississippi.[61]
September 2
- 12:00 UTC (8:00 a.m. AST) – Hurricane Irma weakens to a Category 2 hurricane about 1,160 miles (1,865 km) west-northwest of São Vicente, Cape Verde.[57]
September 3
- 12:00 UTC (8:00 a.m. AST) – Hurricane Irma re-intensifies into a Category 3 hurricane about 915 miles (1,470 km) east of Barbuda.[57]
September 4
- 18:00 UTC (2:00 p.m. AST) – Hurricane Irma intensifies into a Category 4 hurricane roughly 520 miles (835 km) east-southeast of Barbuda.[57]
September 5
- 06:00 UTC (2:00 a.m. AST) at 11.6°N 37.9°W – A tropical depression develops from an area of low pressure about 915 miles (1,475 km) west-southwest of Cabo Verde.[62]
- 12:00 UTC (8:00 a.m. AST) – Hurricane Irma intensifies into a Category 5 hurricane roughly 265 miles (425 km) southeast of Barbuda.[57]
- 12:00 UTC (8:00 a.m. AST) at 12.0°N 38.8°W – The tropical depression intensifies into Tropical Storm Jose approximately 965 miles (1,555 km) west of Cabo Verde.[62]
- 12:00 UTC (7:00 a.m. CDT) at 22.2°N 97.2°W – Tropical Depression Thirteen develops from an area of low pressure about 40 miles (65 km) east of Tampico, Tamaulipas.[63]
- 18:00 UTC (2:00 p.m. AST) – Hurricane Irma attains peak winds of 180 mph (290 km/h) about 175 miles (280 km) southeast of Barbuda.[57]
September 6
- 05:45 UTC (1:45 a.m. AST) – Hurricane Irma attains a minimum barometric pressure of 914 mbar (hPa; 26.99 inHg) and simultaneously makes landfall on Barbuda, with winds of 180 mph (290 km/h).[57]
- 06:00 UTC (1:00 a.m. CDT) at 22.2°N 96.4°W – Tropical Depression Thirteen intensifies into Tropical Storm Katia about 95 miles (155 km) east of Tampico, Tamaulipas.[63]
- 11:15 UTC (7:15 a.m. AST) – Hurricane Irma makes its second landfall on St. Martin, with winds of 180 mph (290 km/h).[57]
- 16:30 UTC (12:30 p.m. AST) – Hurricane Irma makes its third landfall on Virgin Gorda, British Virgin Islands, with winds of 180 mph (290 km/h).[57]
- 18:00 UTC (2:00 p.m. AST) at 13.7°N 45.2°W – Tropical Storm Jose intensifies into a Category 1 hurricane about 955 miles (1,535 km) east of Barbados.[62]
- 18:00 UTC (1:00 p.m. CDT) at 21.8°N 95.2°W – Tropical Storm Katia intensifies into a Category 1 hurricane approximately 190 miles (305 km) north-northeast of Veracruz, Veracruz.[63]
September 7
- 12:00 UTC (8:00 a.m. AST) at 14.7°N 49.9°W – Hurricane Jose intensifies into a Category 2 hurricane about 650 miles (1,045 km) east-northeast of Barbados.[62]
- 18:00 UTC (2:00 p.m. AST) at 15.1°N 51.5°W – Hurricane Jose intensifies into a Category 3 hurricane roughly 785 miles (1,265 km) southeast of the northernmost Leeward Islands.[62]
September 8

- 05:00 UTC (1:00 a.m. EDT) – Hurricane Irma weakens to a Category 4 hurricane and makes its fourth landfall on Little Inagua, Bahamas, with winds of 155 mph (250 km/h).[57]
- 06:00 UTC (2:00 a.m. AST) at 15.9°N 54.9°W – Hurricane Jose intensifies into a Category 4 hurricane about 555 miles (895 km) southeast of the northernmost Leeward Islands.[62]
- 12:00 UTC (7:00 a.m. CDT) at 21.1°N 95.7°W – Hurricane Katia intensifies into a Category 2 hurricane about 135 miles (215 km) north-northeast of Veracruz, Veracruz.[63]
- 18:00 UTC (2:00 p.m. EDT) – Hurricane Irma re-intensifies into a Category 5 hurricane about 130 miles (215 km) northeast of Camagüey, Cuba.[57]
- 18:00 UTC (2:00 p.m. AST) at 16.4°N 57.8°W – Hurricane Jose attains maximum sustained winds of 155 mph (250 km/h).[62]
- 18:00 UTC (1:00 p.m. CDT) at 21.1°N 96.2°W – Hurricane Katia attains its peak intensity with maximum sustained winds of 105 mph (165 km/h) and a minimum barometric pressure of 972 mbar (hPa; 28.71 inHg) roughly 135 miles (215 km) north of Veracruz, Veracruz.[63]
September 9
- 00:00 UTC (8:00 p.m. AST September 8) at 16.7°N 58.9°W – Hurricane Jose attains a minimum barometric pressure of 938 mbar (hPa; 27.70 inHg).[62]
- 00:00 UTC (7:00 p.m. CDT September 8) at 20.8°N 96.9°W – Hurricane Katia weakens to a Category 1 hurricane about 35 miles (55 km) southeast of Tuxpan, Veracruz.[63]
- 03:00 UTC (11:00 a.m. EDT September 8) – Hurricane Irma makes its fifth landfall near Cayo Romano, Cuba, with winds of 165 mph (265 km/h).[57]
- 03:00 UTC (10:00 p.m. CDT September 8) at 20.6°N 97.1°W – Hurricane Katia makes landfall in Tecolutla, Veracruz, with winds of 75 mph (120 km/h).[63]
- 06:00 UTC (2:00 a.m. EDT) – Hurricane Irma weakens to a Category 4 hurricane about 265 miles (425 km) southeast of Key West, Florida.[57]
- 06:00 UTC (1:00 a.m. CDT) at 20.3°N 97.4°W – Hurricane Katia weakens to a tropical storm approximately 110 miles (175 km) north-northwest of Veracruz, Veracruz.[63]
- 12:00 UTC (8:00 a.m. EDT) – Hurricane Irma weakens to a Category 3 hurricane about 200 miles (320 km) southeast of Key West, Florida.[57]
- 18:00 UTC (2:00 p.m. EDT) – Hurricane Irma weakens to a Category 2 hurricane about 140 miles (220 km) southeast of Key West, Florida.[57]
- 18:00 UTC (1:00 p.m. CDT) – Tropical Depression Katia dissipates over the high terrain of eastern Mexico.[63]
September 10
- 00:00 UTC (8:00 p.m. EDT September 9) – Hurricane Irma re-intensifies into a Category 3 hurricane about 95 miles (155 km) south-southeast of Key West, Florida.[57]
- 06:00 UTC (2:00 a.m. EDT) – Hurricane Irma re-intensifies into a Category 4 hurricane about 65 miles (100 km) south-southeast of Key West, Florida.[57]
- 13:00 UTC (9:00 a.m. EDT) – Hurricane Irma makes its sixth landfall on Cudjoe Key, Florida, with winds of 130 mph (215 km/h).[57]
- 18:00 UTC (2:00 p.m. EDT) – Hurricane Irma weakens to a Category 3 hurricane about 25 miles (40 km) south of Marco Island, Florida.[57]
- 18:00 UTC (2:00 p.m. AST) at 22.2°N 66.5°W – Hurricane Jose weakens to a Category 3 hurricane about 260 miles (420 km) north of San Juan, Puerto Rico.[62]
- 19:30 UTC (3:30 p.m. EDT) – Hurricane Irma makes its seventh and final landfall near Marco Island, Florida, with winds of 115 mph (185 km/h).[57]
September 11
- 00:00 UTC (8:00 p.m. EDT) at 26.8°N 81.7°W – Hurricane Irma weakens to a Category 1 hurricane about 5 miles (10 km) north of Olga, Florida.[57]
- 06:00 UTC (2:00 a.m. AST) at 24.3°N 68.6°W – Hurricane Jose weakens to a Category 2 hurricane about 255 miles (410 km) northeast of Cockburn Town, Turks and Caicos Islands.[62]
- 12:00 UTC (8:00 a.m. EDT) at 29.6°N 82.7°W – Hurricane Irma weakens to a tropical storm about 5 miles (10 km) east of Trenton, Florida.[57]
- 18:00 UTC (2:00 p.m. AST) at 26.5°N 69.5°W – Hurricane Jose weakens to a Category 1 hurricane about 365 miles (585 km) north-northeast of Cockburn Town, Turks and Caicos Islands.[62]
September 12
- 06:00 UTC (2:00 a.m. EDT) at 32.9°N 85.6°W – Tropical Storm Irma degenerates to a remnant area of low pressure about 20 miles (30 km) north-northwest of Auburn, Alabama.[57]
September 14
- 18:00 UTC (2:00 p.m. AST) at 10.4°N 23.1°W – Tropical Depression Fourteen develops from an area of low pressure about 305 miles (490 km) south of Cabo Verde.[64]
September 15
- 00:00 UTC (8:00 p.m. EDT September 14) at 25.4°N 67.6°W – Hurricane Jose weakens to a tropical storm about 350 miles (565 km) northeast of Cockburn Town, Turks and Caicos Islands.[62]
- 18:00 UTC (2:00 p.m. EDT) at 26.8°N 69.9°W – Tropical Storm Jose re-intensifies into a Category 1 hurricane roughly 670 miles (1,080 km) southeast of Cape Hatteras, North Carolina.[62]
September 16
- 12:00 UTC (8:00 a.m. AST) at 12.5°N 33.1°W – Tropical Depression Fourteen intensifies into Tropical Storm Lee about 580 miles (935 km) southwest of Cabo Verde.[64]
- 15:00 UTC (11:00 a.m. AST) at 12.2°N 50.5°W – Potential Tropical Cyclone Fifteen develops about 755 miles (1220 km) east-southeast of the Lesser Antilles.[65]
- 18:00 UTC (2:00 p.m. AST) at 11.9°N 51.6°W – Potential Tropical Cyclone Fifteen strengthens into Tropical Depression Fifteen roughly 695 miles (1120 km) east-southeast of the Lesser Antilles.[66]
- 21:00 UTC (05:00 p.m. AST) at 12.3°N 52.6°W – Tropical Depression Fifteen intensifies into Tropical Storm Maria about 620 miles (1000 km) east-southeast of the Lesser Antilles.[67]
September 17
- 12:00 UTC (8:00 a.m. AST) at 12.9°N 36.2°W – Tropical Storm Lee weakens to a tropical depression about 780 miles (1,255 km) west-southwest of Cabo Verde.[64]
- 21:00 UTC (5:00 p.m. AST) at 13.8°N 57.5°W – Tropical Storm Maria intensifies into a Category 1 hurricane about 140 miles (225 km) east-northeast of Barbados.[68]
September 18
- 12:00 UTC (08:00 a.m.) at 14.6°N 59.7°W – Hurricane Maria strengthens into a Category 2 hurricane about 85 miles (135 km) east of Martinique.[69]
- 15:00 UTC (11:00 a.m.) at 14.7°N 60.1°W – Hurricane Maria strengthens into a Category 3 hurricane about 60 miles (95 km) east of Martinique.[70]
- 21:00 UTC (05:00 p.m.) at 15.1°N 60.7°W – Hurricane Maria strengthens into a Category 4 hurricane roughly 45 miles (75 km) east-southeast of Dominica.[71]
- 23:45 UTC (7:45 p.m. AST) at 15.3°N 61.1°W – Hurricane Maria strengthens into a Category 5 hurricane roughly 15 miles (25 km) east-southeast of Dominica.[72]
September 19

- 06:00 UTC (02:00 a.m. AST) at 15.7°N 61.9°W – Hurricane Maria weakens into a Category 4 hurricane roughly 45 miles (70 km) west-northwest of Dominica.[73]
- 09:10 UTC (05:10 am AST) at 16.0°N 62.3°W – Hurricane Maria re-intensifies into a Category 5 hurricane roughly 65 miles (100 km) west-southwest of Guadeloupe.[74]
- 12:00 UTC (8:00 a.m. EDT) at 36.3°N 71.7°W – Hurricane Jose weakens to a tropical storm for a second time about 230 miles (370 km) northeast of Cape Hatteras, North Carolina.[62]
- 18:00 UTC (2:00 p.m. AST) at 16.8°N 44.4°W – Tropical Depression Lee re-intensifies into a tropical storm about 1,310 miles (2,110 km) west of Cabo Verde.[64]
September 20
- 09:00 UTC (05:00 a.m. AST) at 17.9°N 65.6°W – Hurricane Maria weakens into a Category 4 hurricane roughly 15 miles (25 km) south-southwest of Vieques.[75]
- 12:00 UTC (8:00 a.m. AST) at 20.4°N 44.1°W – Tropical Storm Lee degenerates to a trough of low pressure about 1,150 miles (1,850 km) east of the northernmost Leeward Islands.[64]
- 18:00 UTC (02:00 p.m. AST) at 18.5°N 66.9°W – Hurricane Maria weakens into a Category 3 hurricane about 15 miles (25 km) west of Arecibo, Puerto Rico.[76]
- 21:00 UTC (05:00 p.m.) at 18.8°N 67.3°W – Hurricane Maria weakens into a Category 2 hurricane about 25 miles (45 km) north-northwest of Aguadilla, Puerto Rico.[77]
September 21
- 06:00 UTC (6:00 a.m. AST) at 19.4°N 68.2°W – Hurricane Maria restrengthens into a Category 3 hurricane about 55 miles (90 km) north of Punta Cana, Dominican Republic.[78]
September 22
- 12:00 UTC (8:00 a.m. AST) at 30.0°N 48.9°W – The remnants of Lee regenerate into a tropical depression about 950 miles (1,530 km) east-southeast of Bermuda.[64]
- 18:00 UTC (2:00 p.m. EDT) at 39.7°N 69.1°W – Tropical Storm Jose degenerates to a remnant area of low pressure about 120 miles (195 km) south-southeast of Nantucket, Massachusetts.[62]
September 23
- 00:00 UTC (8:00 p.m. AST September 22) at 31.1°N 49.2°W – Tropical Depression Lee re-intensifies into a tropical storm about 915 miles (1,475 km) east-southeast of Bermuda.[64]
September 24
- 06:00 UTC (2:00 a.m. AST) at 31.7°N 50.2°W – Tropical Storm Lee intensifies into a Category 1 hurricane roughly 845 miles (1,360 km) east-southeast of Bermuda.[64]
- 09:00 UTC (05:00 a.m. EDT) at 27.9°N 72.7°W – Hurricane Maria weakens into a Category 2 hurricane about 290 miles (465 km) north-northeast of Great Abaco Island.[79]
September 25
- 00:00 UTC (8:00 p.m. AST September 24) at 31.2°N 49.6°W – Hurricane Lee intensifies into a Category 2 hurricane about 890 miles (1,430 km) east-southeast of Bermuda.[64]
- 06:00 UTC (2:00 a.m. AST) at 31.0°N 49.5°W – Hurricane Lee weakens to a Category 1 hurricane roughly 900 miles (1,450 km) east-southeast of Bermuda.[64]
September 26
- 06:00 UTC (2:00 a.m. AST) at 30.1°N 52.0°W – Hurricane Lee re-intensifies into a Category 2 hurricane about 765 miles (1,230 km) southeast of Bermuda.[64]
September 27
- 12:00 UTC (8:00 a.m. AST) at 30.3°N 56.6°W – Hurricane Lee intensifies into a Category 3 hurricane and attains peak winds of 115 mph (185 km/h) about 495 miles (795 km) southeast of Bermuda.[64]
- 18:00 UTC (2:00 p.m. AST) at 30.8°N 57.0°W – Hurricane Lee attains a minimum barometric pressure of 962 mbar (hPa; 28.41 inHg) about 460 miles (740 km) southeast of Bermuda.[64]
September 28
- 00:00 UTC (8:00 p.m. AST September 27) at 31.4°N 57.2°W – Hurricane Lee weakens to a Category 2 hurricane about 440 miles (710 km) east-southeast of Bermuda.[64]
- 18:00 UTC (2:00 p.m. AST) at 34.3°N 56.6°W – Hurricane Lee weakens to a Category 1 hurricane about 480 miles (770 km) northeast of Bermuda.[64]
September 29
- 18:00 UTC (2:00 p.m. AST) at 41.0°N 48.2°W – Hurricane Lee weakens to a tropical storm about 900 miles (1,450 km) west of the Azores.[64]
September 30
- 06:00 UTC (2:00 a.m. AST) at 45.8°N 38.9°W – Tropical Storm Lee degenerates to a remnant area of low pressure about 590 miles (950 km) northwest of the Azores.[64]
October

October 4
- 15:00 UTC (11:00 a.m. EDT) at 12.2°N 81.9°W – Tropical Depression Sixteen forms from an area of low pressure approximately 25 miles (40 km) south-southwest of San Andres Island.[80]
October 5
- 12:00 UTC (08:00 a.m. EDT) at 13.9°N 83.4°W – Tropical Depression Sixteen intensifies into Tropical Storm Nate roughly 10 miles (15 km) south of Puerto Cabezas, Nicaragua.[81]
October 7
- 03:30 UTC (10:30 p.m. CDT October 6) at 22.4°N 86.3°W – Tropical Storm Nate intensifies into a Category 1 hurricane roughly 95 miles (155 km) west-northwest of Cuba.[82]
October 8
- 00:00 UTC (7:00 p.m. CDT October 7) at 29.0°N 89.2°W – Hurricane Nate makes its first landfall near the mouth of the Mississippi River with winds of 85 mph (140 km/h).[83]
- 05:30 UTC (12:30 a.m. CDT) at 30.4°N 89.0°W – Hurricane Nate makes its second and final landfall near Biloxi, Mississippi.[84]
- 09:00 UTC (4:00 a.m. CDT) at 31.5°N 88.4°W – Hurricane Nate moves inland and deteriorates, becoming a tropical storm about 80 mi (130 km) north-northeast of Biloxi Mississippi.[85]
- 15:00 UTC (10:00 a.m. CDT) at 31.1°N 87.3°W – Spreading heavy rain in its wake, Tropical Storm Nate weakens into a tropical depression about 40 mi (65 km) southwest of Birmingham, Alabama.[86]
October 9
- 09:00 UTC (5:00 a.m. EDT) at 40.7°N 81.7°W – Located about 20 mi (35 km) southwest of Akron, Ohio, Tropical Depression Nate has become post-tropical.[87]
- 09:00 UTC (5:00 a.m. AST) at 31.1°N 39.9°W – Depression Seventeen forms roughly 875 mi (1405 km) west-southwest of the Azores.[88]
- 15:00 UTC (11:00 a.m. AST) at 31.4°N 39.9°W – Tropical Depression Seventeen strengthens into Tropical Storm Ophelia about 860 mi (1385 km) west-southwest of the Azores.[89]
October 11
- 21:00 UTC (5:00 p.m. AST) at 30.0°N 36.1°W – Tropical Storm Ophelia becomes the tenth hurricane of the 2017 season about 760 mi (1220 km) southwest of the Azores.[90]
October 12
- 21:00 UTC (5:00 p.m. AST) at 30.4°N 35.5°W – Nearly stationary, Hurricane Ophelia intensifies to Category 2 about 715 mi (1150 km) southwest of the Azores.[91]
October 14
- 15:00 UTC (11:00 a.m. AST) at 34.8°N 26.6°W – Hurricane Ophelia intensifies to Category 3, becoming the sixth major hurricane of the 2017 season, and simultaneously attains its greatest strength with maximum sustained winds of 115 mph (185 km/h) and a central pressure of 960 mb (hPa; 28.35 inHg) while about 220 mi (355 km) south of the Azores.[92]
October 15
- 09:00 UTC (5:00 a.m. AST) at 39.0°N 18.3°W – Hurricane Ophelia weakens to a Category 2 storm with maximum sustained winds of 105 mph (165 kn/h) about 475 mi (765 km) east of the Azores.[93]
- 15:00 UTC (11:00 a.m. AST) at 41.6°N 16.0°W – Hurricane Ophelia weakens to a Category 1 storm with maximum sustained winds of 90 mph (150 kn/h) about 635 mi (1020 km) east-northeast of the Azores.[94]
October 16
- 03:00 UTC (11:00 p.m. AST October 15) at 49.2°N 13.3°W – Hurricane Ophelia has transitioned into a post-tropical cyclone about 220 mi (355 km) southwest of Mizen Head, Ireland.[95]
October 27
- 21:00 UTC (5:00 p.m. EDT) at 17.5°N 84.5°W – Potential Tropical Cyclone Eighteen develops about 305 miles (490 km) south-southwest of Isla de la Juventud, Cuba, in the western Caribbean Sea.[96]
October 28
- 12:00 UTC (8:00 a.m. EDT) at 20.1°N 83.5°W – Potential Tropical Cyclone Eighteen organizes into Tropical Depression Eighteen about 100 miles (160 km) south-southwest of Isla de la Juventud.[97]
- 18:00 UTC (2:00 p.m. EDT) at 21.3°N 82.4°W – Tropical Depression Eighteen intensifies into Tropical Storm Philippe and simultaneously attains its peak intensity with winds of 40 mph (65 km/h) and a minimum barometric pressure of 1000 mbar (hPa; 29.53 inHg) roughly 20 miles (30 km) southeast of Isla de la Juventud.[97]
- 22:00 UTC (6:00 p.m. EDT) at 22.2°N 81.6°W – Tropical Storm Philippe makes landfall along Cuba's Zapata Peninsula with winds of 40 mph (65 km/h).[97]
October 29
- 00:00 UTC (8:00 p.m. EDT October 28) at 22.7°N 81.2°W – Tropical Storm Philippe weakens to a tropical depression approximately 5 miles (10 km) west-northwest of Agramonte, Cuba.[97]
- 06:00 UTC (2:00 a.m. EDT) – Tropical Depression Philippe dissipates over west-central Cuba.[nb 3][97]
November

November 5
- 18:00 UTC (2:00 p.m. AST) at 29.2°N 51.7°W – Tropical Depression Nineteen develops from an area of low pressure about 805 miles (1,295 km) east-southeast of Bermuda.[98]
November 7
- 00:00 UTC (8:00 p.m. AST November 6) at 30.0°N 50.0°W – Tropical Depression Nineteen intensifies into Tropical Storm Rina roughly 900 miles (1,450 km) east of Bermuda.[98]
November 8
- 06:00 UTC (2:00 a.m. AST) at 36.4°N 48.7°W – Tropical Storm Rina attains peak sustained winds of 60 mph (95 km/h).[98]
November 9
- 00:00 UTC (8:00 p.m. AST November 8) at 41.8°N 48.8°W – Tropical Storm Rina attains a minimum barometric pressure of 991 mbar (hPa; 29.27 inHg).[98]
- 06:00 UTC (2:00 a.m. AST) at 43.6°N 48.0°W – Tropical Storm Rina degenerates to a remnant area of low pressure approximately 345 miles (555 km) southeast of Cape Race, Newfoundland.[98]
November 30
- The 2017 Atlantic hurricane season officially ends.[3]
Notes
- An average Atlantic hurricane season, as defined by the National Oceanic and Atmospheric Administration, has 12 tropical storms, six hurricanes and two major hurricanes.[1]
- The figures for maximum sustained winds and position estimates are rounded to the nearest 5 units (knots, miles, or kilometers), following the convention used in the National Hurricane Center's operational products for each storm. All other units are rounded to the nearest digit.
- Operationally, Philippe was assessed as crossing the Florida Keys and exiting into the western Atlantic, but post-analysis showed that it was a non-tropical area of low pressure that was interacting with Philippe.[97]
References
- "Background Information: North Atlantic Hurricane Season". College Park, Maryland: NOAA Climate Prediction Center. Retrieved July 11, 2020.
- Vaccaro, Chris (November 30, 2017). "Extremely active 2017 Atlantic hurricane season finally ends". Washington, D.C.: National Oceanic and Atmospheric Administration. Retrieved July 11, 2020.
- Dorst, Neal (June 1, 2018). "Hurricane Season Information". Frequently Asked Questions About Hurricanes. Miami, Florida: NOAA Atlantic Oceanographic and Meteorological Laboratory. Retrieved June 29, 2020.
- Donegan, Brian (September 30, 2017). "September 2017 Was the Most Active Month on Record for Atlantic Hurricanes". weather.com. The Weather Channel. Retrieved July 11, 2010.
- "Understanding the Date/Time Stamps". miami, Florida: NOAA National Hurricane Center. Retrieved July 10, 2020.
- Cangialosi, John P. (July 5, 2017). Tropical Cyclone Report: Tropical Storm Arlene (PDF) (Report). Miami, Florida: National Hurricane Center. Retrieved July 20, 2017.
- Brennan, Michael J. (June 18, 2017). Potential Tropical Cyclone Two Advisory Number 1 (Report). Miami, Florida: National Hurricane Center. Retrieved June 23, 2017.
- Brennan, Michael J. (March 5, 2018). Tropical Cyclone Report: Tropical Storm Bret (PDF) (Report). Miami, Florida: National Hurricane Center. Retrieved March 10, 2018.
- Brennen, Michael J. (June 19, 2017). Potential Tropical Cyclone Three Public Advisory Number 1 (Report). Miami, Florida: National Hurricane Center. Retrieved June 23, 2017.
- Avila, Lixion A. (June 20, 2017). Tropical Storm Bret Intermediate Advisory Number 7A (Report). Miami Florida: NWS National Hurricane Center. Retrieved July 11, 2020.
- Berg, Robbie J. (January 26, 2018). Tropical Cyclone Report: Tropical Storm Cindy (PDF) (Report). Miami, Florida: National Hurricane Center. Retrieved March 8, 2018.
- Avila, Lixion A. (October 20, 2017). Tropical Cyclone Report: Tropical Depression Four (PDF) (Report). Miami, Florida: National Hurricane Center. Retrieved March 10, 2018.
- Avila, Lixion A. (July 7, 2017). Tropical Depression Four Advisory Number 7 (Report). Miami Florida: NWS National Hurricane Center. Retrieved July 11, 2020.
- Blake, Eric S. (December 19, 2017). Tropical Cyclone Report: Tropical Storm Don (PDF) (Report). Miami, Florida: National Hurricane Center. Retrieved March 10, 2018.
- Berg, Robbie J. (Jul 17, 2017). Tropical Storm Don Intermediate Advisory Number 1A (Report). Miami Florida: NWS National Hurricane Center. Retrieved July 11, 2020.
- Brown, Daniel P. (Jul 18, 2017). Tropical Storm Don Intermediate Advisory Number 4A (Report). Miami Florida: NWS National Hurricane Center. Retrieved July 11, 2020.
- Brown, Daniel P. (July 31, 2017). Tropical Depression Six Special Advisory Number 1 (Report). Miami, Florida: NWS National Hurricane Center. Retrieved August 8, 2017.
- Stewart, Stacy R. (July 31, 2017). Tropical Storm Emily Special Advisory Number 2 (Report). Miami, Florida: NWS National Hurricane Center. Retrieved August 8, 2017.
- Stewart, Stacy R. (July 31, 2017). Tropical Storm Emily Advisory Number 3 (Report). Miami, Florida: NWS National Hurricane Center. Retrieved August 8, 2017.
- Stewart, Stacy R. (July 31, 2017). Tropical Storm Emily Tropical Cyclone Update (Report). Miami, Florida: NWS National Hurricane Center. Retrieved August 8, 2017.
- Stewart, Stacy R. (July 31, 2017). Tropical Depression Emily Advisory Number 4 (Report). Miami, Florida: NWS National Hurricane Center. Retrieved August 8, 2017.
- Blake, Eric S. (August 1, 2017). Post-Tropical Cyclone Emily Advisory Number 9 (Report). Miami, Florida: NWS National Hurricane Center. Retrieved August 8, 2017.
- Pasch, Richard J. (August 6, 2017). Potential Tropical Cyclone Seven Advisory Number 1 (Report). Miami, Florida: NWS National Hurricane Center. Retrieved August 8, 2017.
- Brown, Daniel P. (August 6, 2017). Tropical Storm Franklin Advisory Number 2 (Report). Miami, Florida: NWS National Hurricane Center. Retrieved August 8, 2017.
- Stewart, Stacy R.; Landsea, Christopher W. (August 7, 2017). Tropical Storm Franklin Tropical Cyclone Update (Report). Miami, Florida: NWS National Hurricane Center. Retrieved August 8, 2017.
- Berg, Robbie J. (August 8, 2017). Tropical Storm Franklin Intermediate Advisory Number 9A (Report). Miami Florida: NWS National Hurricane Center. Retrieved July 11, 2020.
- Pasch, Richard J. (August 9, 2017). Hurricane Franklin Public Advisory Number 13 (Report). Miami, Florida: NWS National Hurricane Center. Retrieved August 10, 2017.
- Avila, Lixion (August 9, 2017). Hurricane Franklin Intermediate Advisory Number 13A (Report). Miami, Florida: NWS National Hurricane Center. Retrieved August 10, 2017.
- Beven, John L. (August 10, 2017). Hurricane Franklin Intermediate Advisory Number 14A (Report). Miami, Florida: NWS National Hurricane Center. Retrieved August 15, 2017.
- Beven, John L. (August 10, 2017). Tropical Storm Franklin Public Advisory Number 15 (Report). Miami, Florida: NWS National Hurricane Center. Retrieved August 15, 2017.
- Pasch, Richard J. (August 10, 2017). Remnants of Franklin Public Advisory Number 16 (Report). Miami, Florida: NWS National Hurricane Center. Retrieved August 15, 2017.
- Brown, Daniel P. (August 12, 2017). Tropical Depression Eight Public Advisory Number 1 (Report). Miami, Florida: NWS National Hurricane Center. Retrieved August 13, 2017.
- Cangialosi, John P. (August 13, 2017). Tropical Storm Gert Public Advisory Number 4 (Report). Miami, Florida: NWS National Hurricane Center. Retrieved August 13, 2017.
- Blake, Eric S. (August 14, 2017). Hurricane Gert Public Advisory Number 9 (Report). Miami, Florida: NWS National Hurricane Center. Retrieved August 15, 2017.
- Berg, Robbie J. (August 16, 2017). Hurricane Gert Public Advisory Number 16 (Report). Miami, Florida: NWS National Hurricane Center. Retrieved September 4, 2017.
- Pasch, Richard J. (August 16, 2017). Hurricane Gert Public Advisory Number 17 (Report). Miami, Florida: NWS National Hurricane Center. Retrieved September 4, 2017.
- Zelinsky, David A. (August 17, 2017). Hurricane Gert Public Advisory Number 19 (Report). Miami, Florida: NWS National Hurricane Center. Retrieved September 4, 2017.
- Beven, John L. (August 17, 2017). Potential Tropical Cyclone Nine Public Advisory Number 1 (Report). Miami, Florida: NWS National Hurricane Center. Retrieved September 4, 2017.
- Zelinsky, David A. (August 17, 2017). Post-Tropical Cyclone Gert Public Advisory Number 20 (Report). Miami, Florida: NWS National Hurricane Center. Retrieved September 4, 2017.
- Beven, John L. (August 17, 2017). Tropical Storm Harvey Public Advisory Number 2 (Report). Miami, Florida: National Hurricane Center. Retrieved September 4, 2017.
- Beven, John L. (August 19, 2017). Tropical Depression Harvey Public Advisory Number 10 (Report). Miami, Florida: NWS National Hurricane Center. Retrieved September 4, 2017.
- Berg, Robbie J. (August 19, 2017). Remnants of Harvey Public Advisory Number 11 (Report). Miami, Florida: NWS National Hurricane Center. Retrieved September 4, 2017.
- Blake, Eric S. (August 23, 2017). Tropical Depression Harvey Public Advisory Number 12 (Report). Miami, Florida: NWS National Hurricane Center. Retrieved September 9, 2017.
- Avila, Lixion A.; Zelinsky, David A. (August 23, 2017). Tropical Storm Harvey Tropical Cyclone Update (Report). Miami, Florida: NWS National Hurricane Center. Retrieved September 9, 2017.
- Berg, Robbie J.; Brennan, Michael J. (August 24, 2017). Hurricane Harvey Tropical Cyclone Update (Report). Miami, Florida: NWS National Hurricane Center. Retrieved September 9, 2017.
- Zelinsky, David A. (August 25, 2017). Hurricane Harvey Tropical Cyclone Update (Report). Miami, Florida: NWS National Hurricane Center. Retrieved September 9, 2017.
- Brown, Daniel P. (August 25, 2017). Hurricane Harvey Tropical Cyclone Update (Report). Miami, Florida: NWS National Hurricane Center. Retrieved September 9, 2017.
- Blake, Eric S. (August 25, 2017). Hurricane Harvey Tropical Cyclone Update (Report). Miami, Florida: NWS National Hurricane Center. Retrieved September 9, 2017.
- Beven, John L. (August 25, 2017). Hurricane Harvey Public Advisory Number 23 (Report). Miami, Florida: NWS National Hurricane Center. Retrieved September 9, 2017.
- Berg, Robbie J. (August 25, 2017). Hurricane Harvey Intermediate Advisory Number 23A (Report). Miami, Florida: NWS National Hurricane Center. Retrieved September 11, 2017.
- Zelinsky, David A. (August 26, 2017). Hurricane Harvey Tropical Cyclone Update (Report). Miami, Florida: NWS National Hurricane Center. Retrieved September 11, 2017.
- Zelinsky, David A. (August 26, 2017). Hurricane Harvey Tropical Cyclone Update (Report). Miami, Florida: NWS National Hurricane Center. Retrieved September 11, 2017.
- Avila, Lixion A. (August 26, 2017). Tropical Storm Harvey Intermediate Advisory Number 25A (Report). Miami, Florida: NWS National Hurricane Center. Retrieved September 11, 2017.
- Brown, Daniel P. (January 26, 2017). Potential Tropical Cyclone Ten (PDF) (Report). Miami, Florida: National Hurricane Center. Retrieved March 12, 2018.
- Landsea, Christopher W. (August 28, 2017). Potential Tropical Cyclone Ten Intermediate Advisory Number 2A (Report). Miami Florida: NWS National Hurricane Center. Retrieved July 11, 2020.
- Beven, John L. (August 28, 2017). Tropical Storm Harvey Intermediate Advisory Number 32A (Report). Miami Florida: NWS National Hurricane Center. Retrieved July 11, 2020.
- Cangialosi, John P.; Latta, Andrew S.; Berg, Robbie J. (March 9, 2018). Tropical Cyclone Report: Hurricane Irma (PDF) (Report). Miami, Florida: National Hurricane Center. Retrieved March 12, 2018.
- Berg, Robbie J. (August 30, 2017). Tropical Storm Harvey Public Advisory Number 40 (Report). Miami, Florida: NWS National Hurricane Center. Retrieved September 11, 2017.
- Brown, Daniel P. (August 30, 2017). Tropical Depression Harvey Intermediate Advisory Number 42A (Report). Miami, Florida: NWS National Hurricane Center. Retrieved September 11, 2017.
- Blake, Eric S. (August 31, 2017). "NWS Hurricane Irma Advisory Number 6". National Hurricane Center. Retrieved August 4, 2018.
- Kong, Kwan-Yin (September 1, 2017). Tropical Depression Harvey Advisory Number 47 (Report). College Park, Maryland: NWS Weather Prediction Center. Retrieved July 11, 2020.
- Berg, Robbie J. (February 20, 2018). Tropical Cyclone Report: Hurricane Jose (PDF) (Report). Miami, Florida: NWS National Hurricane Center. Retrieved March 10, 2018.
- Avila, Lixion A. (November 28, 2017). Tropical Cyclone Report: Hurricane Katia (PDF) (Report). Miami, Florida: National Hurricane Center. Retrieved March 12, 2018.
- Blake, Eric S. (February 13, 2018). Tropical Cyclone Report: Hurricane Lee (PDF) (Report). Miami, Florida: National Hurricane Center. Retrieved March 11, 2018.
- Cangialosi, John (September 16, 2017). Potential Tropical Cyclone Fifteen Public Advisory Number 1 (Report). Miami, Florida: NWS National Hurricane Center. Retrieved October 9, 2017.
- Cangialosi, John (September 16, 2017). Tropical Depression Fifteen Public Advisory Number 1A (Report). Miami, Florida: NWS National Hurricane Center. Retrieved October 9, 2017.
- Cangialosi, John (September 16, 2017). Tropical Storm Maria Public Advisory Number 2 (Report). Miami, Florida: NWS National Hurricane Center. Retrieved October 9, 2017.
- Berg, Robbie J. (September 17, 2017). Hurricane Maria Public Advisory Number 6 (Report). Miami, Florida: NWS National Hurricane Center. Retrieved October 9, 2017.
- Beven, Jack L. (September 18, 2017). Hurricane Maria Public Advisory Number 8A (Report). Miami, Florida: NWS National Hurricane Center. Retrieved October 9, 2017.
- Beven, Jack L. (September 18, 2017). Hurricane Maria Public Advisory Number 9 (Report). Miami, Florida: NWS National Hurricane Center. Retrieved October 9, 2017.
- Beven, Jack L. (September 18, 2017). Hurricane Maria Public Advisory Number 10 (Report). Miami, Florida: NWS National Hurricane Center. Retrieved October 9, 2017.
- Brown, Dan; Blake, Eric (September 18, 2017). Hurricane Maria Tropical Cyclone Update (Report). Miami, Florida: NWS National Hurricane Center. Retrieved October 9, 2017.
- Pasch, Richard (September 19, 2017). Hurricane Maria Public Advisory Number 12A (Report). Miami, Florida: NWS National Hurricane Center. Retrieved October 11, 2017.
- Pasch, Richard (September 19, 2017). Hurricane Maria Tropical Cyclone Update (Report). Miami, Florida: NWS National Hurricane Center. Retrieved October 11, 2017.
- Pasch, Richard (September 20, 2017). Hurricane Maria Public Advisory Number 17 (Report). Miami, Florida: NWS National Hurricane Center. Retrieved October 11, 2017.
- Berg, Robbie J. (September 20, 2017). Hurricane Maria Intermediate Advisory Number 18A (Report). Miami, Florida: NWS National Hurricane Center. Retrieved October 11, 2017.
- Berg, Robbie J. (September 20, 2017). Hurricane Maria Public Advisory Number 19 (Report). Miami, Florida: NWS National Hurricane Center. Retrieved October 16, 2017.
- Pasch, Richard (September 21, 2017). Hurricane Maria Public Intermediate Advisory Number 20A (Report). Miami, Florida: NWS National Hurricane Center. Retrieved October 16, 2017.
- Beven, Jack (September 24, 2017). Hurricane Maris Public Advisory Number 33 (Report). Miami, Florida: NWS National Hurricane Center. Retrieved October 17, 2017.
- Blake, Eric (October 4, 2017). Tropical Depression Sixteen Advisory Number 1 (Report). Miami, Florida: NWS National Hurricane Center. Retrieved August 4, 2018.
- Beven, Jack (October 5, 2017). Tropical Storm Nate Intermediate Advisory Number 4A (Report). Miami, Florida: NWS National Hurricane Center. Retrieved August 4, 2018.
- Avila, Lixion; Berg, Robbie J. (October 6, 2017). Hurricane Nate Tropical Cyclone Update (Report). Miami, Florida: NWS National Hurricane Center. Retrieved August 4, 2018.
- Berg, Robbie J. (October 7, 2017). Hurricane Nate Intermediate Advisory Number 14A (Report). Miami, Florida: NWS National Hurricane Center. Retrieved August 4, 2018.
- Cangialosi, John; Avila, Lixion (October 8, 2017). Hurricane Nate Tropical Cyclone Update (Report). Miami, Florida: NWS National Hurricane Center. Retrieved August 4, 2018.
- Avila, Lixion (October 8, 2017). Tropical Storm Nate Advisory Number 16...Corrected (Report). Miami, Florida: NWS National Hurricane Center. Retrieved July 11, 2020.
- Brown, Daniel P. (October 8, 2017). Tropical Depression Nate Advisory Number 17 (Report). Miami, Florida: NWS National Hurricane Center. Retrieved July 11, 2020.
- Tate, Jennifer (October 9, 2017). Post-Tropical Cyclone Nate Advisory Number 20 (Report). College Park, Maryland: NWS Weather Prediction Center. Retrieved July 11, 2020.
- Cangialosi, John P. (October 9, 2017). Tropical Depression Seventeen Advisory Number 1 (Report). Miami Florida: NWS National Hurricane Center. Retrieved July 11, 2020.
- Stewart, Stacy R. (October 9, 2017). Tropical Storm Ophelia Advisory Number 2 (Report). Miami Florida: NWS National Hurricane Center. Retrieved July 11, 2020.
- Zelinsky, David A. (October 11, 2017). Hurricane Ophelia Advisory Number 11 (Report). Miami Florida: NWS National Hurricane Center. Retrieved July 11, 2020.
- Zelinsky, David A. (October 12, 2017). Hurricane Ophelia Advisory Number 15 (Report). Miami Florida: NWS National Hurricane Center. Retrieved July 11, 2020.
- Avila, Lixion (October 14, 2017). Hurricane Ophelia Advisory Number 22 (Report). Miami Florida: NWS National Hurricane Center. Retrieved July 11, 2020.
- Stewart, Stacy R. (October 15, 2017). Hurricane Ophelia Advisory Number 25 (Report). Miami Florida: NWS National Hurricane Center. Retrieved July 11, 2020.
- Avila, Lixion (October 15, 2017). Hurricane Ophelia Advisory Number 26 (Report). Miami Florida: NWS National Hurricane Center. Retrieved July 11, 2020.
- Berg, Robbie J. (October 15, 2017). Post-Tropical Cyclone Ophelia Advisory Number 28 (Report). Miami Florida: NWS National Hurricane Center. Retrieved July 11, 2020.
- Brennan, Michael J. (October 27, 2017). Potential Tropical Cyclone Eighteen Public Advisory Number 1 (Report). Miami, Florida: NWS National Hurricane Center. Retrieved March 9, 2018.
- Brown, Daniel P. (January 31, 2018). Tropical Cyclone Report: Tropical Storm Philippe (PDF) (Report). Miami, Florida: National Hurricane Center. Retrieved March 9, 2018.
- Cangialosi, John P. (January 9, 2018). Tropical Cyclone Report: Tropical Storm Rina (PDF) (Report). Miami, Florida: National Hurricane Center. Retrieved March 8, 2018.
External links
| Wikimedia Commons has media related to 2017 Atlantic hurricane season. |