Texas's 15th congressional district
Texas's 15th congressional district of the United States House of Representatives includes a thin section of the far south of the state of Texas. The district's current Representative is Democrat Vicente Gonzalez, first-elected in 2017.
| Texas's 15th congressional district | |||
|---|---|---|---|
.tif.png) Texas's 15th congressional district - since January 3, 2013. | |||
| Representative |
| ||
| Distribution |
| ||
| Population (2016) | 776,887[2] | ||
| Median income | $42,474[3] | ||
| Ethnicity |
| ||
| Cook PVI | D+7[4] | ||
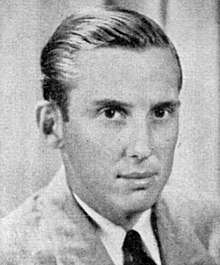
The district's best-known Representative was John Nance Garner, who represented the district from its creation in 1903 until 1933, and was Speaker of the House from 1931 to 1933. He ran with Franklin D. Roosevelt in the 1932 and 1936 presidential campaigns, and was elected Vice President of the United States, serving from 1933 to 1941.
List of members representing the district
| Member | Party | Years | Cong ess |
Electoral history |
|---|---|---|---|---|
| District created | March 4, 1903 | |||
 John N. Garner |
Democratic | March 4, 1903 – March 3, 1933 |
58th 59th 60th 61st 62nd 63rd 64th 65th 66th 67th 68th 69th 70th 71st 72nd |
[data unknown/missing] Resigned to become U.S. Vice-President |
| Vacant | March 4, 1933 – April 23, 1933 | |||
 Milton H. West |
Democratic | April 23, 1933 – October 28, 1948 |
73rd 74th 75th 76th 77th 78th 79th 80th |
Elected to finish Garner's term. Died. |
| Vacant | October 28, 1948 – December 4, 1948 | |||
 Lloyd Bentsen |
Democratic | December 4, 1948 – January 3, 1955 |
80th 81st 82nd 83rd |
Elected to finish West's term. [data unknown/missing] |
 Joe M. Kilgore |
Democratic | January 3, 1955 – January 3, 1965 |
84th 85th 86th 87th 88th |
[data unknown/missing] |
 Kika de la Garza |
Democratic | January 3, 1965 – January 3, 1997 |
89th 90th 91st 92nd 93rd 94th 95th 96th 97th 98th 99th 100th 101st 102nd 103rd 104th |
[data unknown/missing] |
 Rubén Hinojosa |
Democratic | January 3, 1997 – January 3, 2017 |
105th 106th 107th 108th 109th 110th 111th 112th 113th 114th |
[data unknown/missing] |
 Vicente Gonzalez |
Democratic | January 3, 2017 – present |
115th 116th |
Incumbent |
Election results
|
1920 • 1922 • 1924 • 1926 • 1928 • 1930 • 1932 • 1934 • 1936 • 1938 • 1940 • 1942 • 1944 • 1946 • 1948 • 1950 • 1952 • 1954 • 1956 • 1958 • 1960 • 1962 • 1964 • 1966 • 1968 • 1970 • 1972 • 1974 • 1976 • 1978 • 1980 • 1982 • 1984 • 1986 • 1988 • 1990 • 1992 • 1994 • 1996 • 1998 • 2000 • 2002 • 2004 • 2006 (Special) • 2008 • 2010 • 2012 • 2014 • 2016 • 2018 |
1920
| Party | Candidate | Votes | % | |
|---|---|---|---|---|
| Democratic | John N. Garner | 10,265 | 100.00 | |
| Total votes | 10,265 | 100.0 | ||
| Turnout | ||||
| Democratic hold | ||||
1922
| Party | Candidate | Votes | % | |
|---|---|---|---|---|
| Democratic | John N. Garner | 14,366 | 100.00 | |
| Total votes | 14,366 | 100.0 | ||
| Turnout | ||||
| Democratic hold | ||||
1924
| Party | Candidate | Votes | % | |
|---|---|---|---|---|
| Democratic | John N. Garner | 22,776 | 100.00 | |
| Total votes | 22,776 | 100.0 | ||
| Turnout | ||||
| Democratic hold | ||||
1926
| Party | Candidate | Votes | % | |
|---|---|---|---|---|
| Democratic | John N. Garner (Incumbent) | 13,548 | 82.75 | |
| Republican | Hardie F. Jefferies | 2,823 | 17.25 | |
| Total votes | 16,371 | 100.0 | ||
| Turnout | ||||
| Democratic hold | ||||
1928
| Party | Candidate | Votes | % | |
|---|---|---|---|---|
| Democratic | John N. Garner (Incumbent) | 28,417 | 99.99 | |
| Independent | J.L. Burd | 1 | 0.003 | |
| Total votes | 28,418 | 100.0 | ||
| Turnout | ||||
| Democratic hold | ||||
1930
| Party | Candidate | Votes | % | |
|---|---|---|---|---|
| Democratic | John N. Garner (Incumbent) | 20,733 | 77.50 | |
| Republican | Carlos G. Watson | 6,016 | 22.50 | |
| Total votes | 26,749 | 100.0 | ||
| Turnout | ||||
| Democratic hold | ||||
1932
| Party | Candidate | Votes | % | |
|---|---|---|---|---|
| Democratic | John N. Garner (Incumbent) | 44,318 | 85.75 | |
| Republican | Carlos G. Watson | 7,362 | 14.25 | |
| Total votes | 51,680 | 100.0 | ||
| Turnout | ||||
| Democratic hold | ||||
1933 (Special)
| Party | Candidate | Votes | % | |
|---|---|---|---|---|
| Democratic | Milton H. West | 13,546 | 91.20 | |
| Republican | Carlos G. Watson | 1,302 | 8.80 | |
| Total votes | 14,848 | 100.0 | ||
| Turnout | ||||
| Democratic hold | ||||
1934
| Party | Candidate | Votes | % | |
|---|---|---|---|---|
| Democratic | Milton H. West | 20,102 | 100.00 | |
| Total votes | 20,102 | 100.0 | ||
| Turnout | ||||
| Democratic hold | ||||
1936
| Party | Candidate | Votes | % | |
|---|---|---|---|---|
| Democratic | Milton H. West (Incumbent) | 29,508 | 82.53 | |
| Independent | J.A. Simpson | 6,244 | 17.47 | |
| Total votes | 35,752 | 100.0 | ||
| Turnout | ||||
| Democratic hold | ||||
1938
| Party | Candidate | Votes | % | |
|---|---|---|---|---|
| Democratic | Milton H. West (Incumbent) | 18,558 | 99.99 | |
| Other write-in votes | Write-in votes | 2 | 0.010 | |
| Total votes | 18,560 | 100.0 | ||
| Turnout | ||||
| Democratic hold | ||||
1940
| Party | Candidate | Votes | % | |
|---|---|---|---|---|
| Democratic | Milton H. West (Incumbent) | 31,800 | 92.36 | |
| Republican | J.A. Simpson | 2,628 | 7.64 | |
| Total votes | 34,428 | 100.0 | ||
| Turnout | ||||
| Democratic hold | ||||
1942
| Party | Candidate | Votes | % | |
|---|---|---|---|---|
| Democratic | Milton H. West (Incumbent) | 12,169 | 100.00 | |
| Total votes | 12,169 | 100.0 | ||
| Turnout | ||||
| Democratic hold | ||||
1944
| Party | Candidate | Votes | % | |
|---|---|---|---|---|
| Democratic | Milton H. West (Incumbent) | 36,362 | 99.98 | |
| Other write-in votes | Write-in votes | 5 | 0.013 | |
| Total votes | 36,367 | 100.0 | ||
| Turnout | ||||
| Democratic hold | ||||
1946
| Party | Candidate | Votes | % | |
|---|---|---|---|---|
| Democratic | Milton H. West (Incumbent) | 14,623 | 99.98 | |
| Other write-in votes | Write-in votes | 3 | 0.020 | |
| Total votes | 14,626 | 100.0 | ||
| Turnout | ||||
| Democratic hold | ||||
1948 (Special)
| Party | Candidate | Votes | % | |
|---|---|---|---|---|
| Democratic | Lloyd Bentsen | 2,396 | 100.00 | |
| Other write-in votes | Charles McNelly | 1 | 0.00 | |
| Total votes | 2,397 | 100.0 | ||
| Turnout | ||||
| Democratic hold | ||||
1948
| Party | Candidate | Votes | % | |
|---|---|---|---|---|
| Democratic | Lloyd Bentsen (Incumbent) | 27,402 | 100.00 | |
| Total votes | 27,402 | 100.0 | ||
| Turnout | ||||
| Democratic hold | ||||
1950
| Party | Candidate | Votes | % | |
|---|---|---|---|---|
| Democratic | Lloyd Bentsen (Incumbent) | 18,524 | 100.00 | |
| Total votes | 18,524 | 100.0 | ||
| Turnout | ||||
| Democratic hold | ||||
1952
| Party | Candidate | Votes | % | |
|---|---|---|---|---|
| Democratic | Lloyd Bentsen (Incumbent) | 63,767 | 100.00 | |
| Total votes | 63,767 | 100.0 | ||
| Turnout | ||||
| Democratic hold | ||||
1954
| Party | Candidate | Votes | % | |
|---|---|---|---|---|
| Democratic | Joe M. Kilgore | 29,113 | 100.00 | |
| Total votes | 29,113 | 100.0 | ||
| Turnout | ||||
| Democratic hold | ||||
1956
| Party | Candidate | Votes | % | |
|---|---|---|---|---|
| Democratic | Joe M. Kilgore (Incumbent) | 64,011 | 100.00 | |
| Total votes | 64,011 | 100.0 | ||
| Turnout | ||||
| Democratic hold | ||||
1958
| Party | Candidate | Votes | % | |
|---|---|---|---|---|
| Democratic | Joe M. Kilgore (Incumbent) | 28,404 | 100.00 | |
| Total votes | 28,404 | 100.0 | ||
| Turnout | ||||
| Democratic hold | ||||
1960
| Party | Candidate | Votes | % | |
|---|---|---|---|---|
| Democratic | Joe M. Kilgore (Incumbent) | 76,421 | 100.00 | |
| Total votes | 76,421 | 100.0 | ||
| Turnout | ||||
| Democratic hold | ||||
1962
| Party | Candidate | Votes | % | |
|---|---|---|---|---|
| Democratic | Joe M. Kilgore (Incumbent) | 53,552 | 100.00 | |
| Total votes | 53,552 | 100.0 | ||
| Turnout | ||||
| Democratic hold | ||||
1964
| Party | Candidate | Votes | % | |
|---|---|---|---|---|
| Democratic | Kika de la Garza | 66,897 | 69.36 | |
| Republican | Joe B. Coulter | 29,551 | 30.64 | |
| Total votes | 96,448 | 100.0 | ||
| Turnout | ||||
| Democratic hold | ||||
1966
| Party | Candidate | Votes | % | |
|---|---|---|---|---|
| Democratic | Kika de la Garza (Incumbent) | 33,129 | 100.00 | |
| Total votes | 33,129 | 100.0 | ||
| Turnout | ||||
| Democratic hold | ||||
1968
| Party | Candidate | Votes | % | |
|---|---|---|---|---|
| Democratic | Kika de la Garza (Incumbent) | 57,618 | 100.00 | |
| Total votes | 57,618 | 100.0 | ||
| Turnout | ||||
| Democratic hold | ||||
1970
| Party | Candidate | Votes | % | |
|---|---|---|---|---|
| Democratic | Kika de la Garza (Incumbent) | 54,498 | 76.16 | |
| Republican | Ben A. Martinez | 17,049 | 23.82 | |
| Other write-in votes | Write-in votes | 1 | 0.020 | |
| Total votes | 71,548 | 100.0 | ||
| Turnout | ||||
| Democratic hold | ||||
1972
| Party | Candidate | Votes | % | |
|---|---|---|---|---|
| Democratic | Kika de la Garza (Incumbent) | 73,994 | 100.00 | |
| Total votes | 73,994 | 100.0 | ||
| Turnout | ||||
| Democratic hold | ||||
1974
| Party | Candidate | Votes | % | |
|---|---|---|---|---|
| Democratic | Kika de la Garza (Incumbent) | 42,567 | 100.00 | |
| Total votes | 42,567 | 100.0 | ||
| Turnout | ||||
| Democratic hold | ||||
1976
| Party | Candidate | Votes | % | |
|---|---|---|---|---|
| Democratic | Kika de la Garza (Incumbent) | 102,837 | 74.36 | |
| Republican | R.L. (Lendy) McDonald | 35,446 | 25.64 | |
| Total votes | 138,283 | 100.0 | ||
| Turnout | ||||
| Democratic hold | ||||
1978
| Party | Candidate | Votes | % | |
|---|---|---|---|---|
| Democratic | Kika de la Garza (Incumbent) | 54,560 | 66.20 | |
| Republican | R.L. (Lendy) McDonald | 27,853 | 33.80 | |
| Total votes | 82,413 | 100.0 | ||
| Turnout | ||||
| Democratic hold | ||||
1980
| Party | Candidate | Votes | % | |
|---|---|---|---|---|
| Democratic | Kika de la Garza (Incumbent) | 105,325 | 70.02 | |
| Republican | R.L. (Lendy) McDonald | 45,090 | 29.98 | |
| Total votes | 150,145 | 100.0 | ||
| Turnout | ||||
| Democratic hold | ||||
1982
| Party | Candidate | Votes | % | |
|---|---|---|---|---|
| Democratic | Kika de la Garza (Incumbent) | 76,544 | 95.67 | |
| Libertarian | Frank L. Jones III | 3,458 | 4.33 | |
| Total votes | 80,002 | 100.0 | ||
| Turnout | ||||
| Democratic hold | ||||
1984
| Party | Candidate | Votes | % | |
|---|---|---|---|---|
| Democratic | Kika de la Garza (Incumbent) | 104,863 | 100.00 | |
| Total votes | 104,863 | 100.0 | ||
| Turnout | ||||
| Democratic hold | ||||
1986
| Party | Candidate | Votes | % | |
|---|---|---|---|---|
| Democratic | Kika de la Garza (Incumbent) | 70,077 | 100.00 | |
| Total votes | 70,077 | 100.0 | ||
| Turnout | ||||
| Democratic hold | ||||
1988
| Party | Candidate | Votes | % | |
|---|---|---|---|---|
| Democratic | Kika de la Garza (Incumbent) | 93,672 | 93.85 | |
| Libertarian | Gloria Joyce Hendrix | 6,133 | 6.15 | |
| Total votes | 99,805 | 100.0 | ||
| Turnout | ||||
| Democratic hold | ||||
1990
| Party | Candidate | Votes | % | |
|---|---|---|---|---|
| Democratic | Kika de la Garza (Incumbent) | 72,461 | 100.00 | |
| Total votes | 138,283 | 100.0 | ||
| Turnout | ||||
| Democratic hold | ||||
1992
| Party | Candidate | Votes | % | |
|---|---|---|---|---|
| Democratic | Kika de la Garza (Incumbent) | 86,351 | 60.42 | |
| Republican | Tom Haughey | 56,549 | 39.58 | |
| Total votes | 142,900 | 100.0 | ||
| Turnout | ||||
| Democratic hold | ||||
1994
| Party | Candidate | Votes | % | |
|---|---|---|---|---|
| Democratic | Kika de la Garza (Incumbent) | 61,527 | 58.95 | |
| Republican | Tom Haughey | 41,119 | 39.39 | |
| Independent | John c.c. Hamilton | 1,720 | 1.64 | |
| Total votes | 104,366 | 100.0 | ||
| Turnout | ||||
| Democratic hold | ||||
1996
| Party | Candidate | Votes | % | |
|---|---|---|---|---|
| Democratic | Rubén Hinojosa | 86,347 | 62.28 | |
| Republican | Tom Haughey | 50,914 | 36.72 | |
| Natural Law | Rob Wofford | 1,333 | 1.00 | |
| Total votes | 138,621 | 100.0 | ||
| Turnout | ||||
| Democratic hold | ||||
1998
| Party | Candidate | Votes | % | |
|---|---|---|---|---|
| Democratic | Rubén Hinojosa (Incumbent) | 47,957 | 58.35 | |
| Republican | Tom Haughey | 34,221 | 41.65 | |
| Total votes | 82,178 | 100.0 | ||
| Turnout | ||||
| Democratic hold | ||||
2000
| Party | Candidate | Votes | % | |
|---|---|---|---|---|
| Democratic | Rubén Hinojosa (Incumbent) | 106,570 | 88.47 | |
| Libertarian | Frank Jones | 13,167 | 10.93 | |
| Write-in | Israel Cantu | 711 | 0.60 | |
| Total votes | 120,448 | 100.0 | ||
| Turnout | ||||
| Democratic hold | ||||
2002
| Party | Candidate | Votes | % | |
|---|---|---|---|---|
| Democratic | Rubén Hinojosa (Incumbent) | 66,311 | 100.0 | |
| Total votes | 66,311 | 100.0 | ||
| Turnout | ||||
| Democratic hold | ||||
2004
| Party | Candidate | Votes | % | |
|---|---|---|---|---|
| Democratic | Rubén Hinojosa (Incumbent) | 96,089 | 57.76 | |
| Republican | Michael D. Thamm | 67,917 | 40.82 | |
| Libertarian | William R. Cady | 2,352 | 1.41 | |
| Total votes | 166,358 | 100.0 | ||
| Turnout | ||||
| Democratic hold | ||||
2006 (Special)
| Party | Candidate | Votes | % | |
|---|---|---|---|---|
| Democratic | Rubén Hinojosa (Incumbent) | 43,236 | 61.77 | |
| Republican | Paul B. Haring | 16,601 | 23.72 | |
| Republican | Eddie Zamora | 10,150 | 14.51 | |
| Total votes | 69,987 | 100.0 | ||
| Turnout | ||||
| Democratic hold | ||||
2008
| Party | Candidate | Votes | % | |
|---|---|---|---|---|
| Democratic | Rubén Hinojosa (Incumbent) | 107,578 | 67.28 | |
| Republican | Eddie Zamora | 52,303 | 32.72 | |
| Total votes | 159,881 | 100.0 | ||
| Turnout | ||||
| Democratic hold | ||||
2010
| Party | Candidate | Votes | % | |
|---|---|---|---|---|
| Democratic | Rubén Hinojosa (Incumbent) | 53,546 | 55.73 | |
| Republican | Eddie Zamora | 39.964 | 41.59 | |
| Libertarian | Aaron I. Cohn | 2,570 | 2.68 | |
| Total votes | 96,080 | 100.0 | ||
| Turnout | ||||
| Democratic hold | ||||
2012
| Party | Candidate | Votes | % | |
|---|---|---|---|---|
| Democratic | Rubén Hinojosa (Incumbent) | 89,296 | 60.88 | |
| Republican | Dale Brueggemann | 54,056 | 36.85 | |
| Libertarian | Ron Finch | 3,309 | 2.27 | |
| Total votes | 146,661 | 100.0 | ||
| Turnout | ||||
| Democratic hold | ||||
2014
| Party | Candidate | Votes | % | |
|---|---|---|---|---|
| Democratic | Rubén Hinojosa (Incumbent) | 48,708 | 54.01 | |
| Republican | Eddie Zamora | 39,016 | 43.26 | |
| Libertarian | Johnny Partain | 2,460 | 2.73 | |
| Total votes | 90,184 | 100.0 | ||
| Turnout | ||||
| Democratic hold | ||||
2016
| Party | Candidate | Votes | % | |
|---|---|---|---|---|
| Democratic | Vicente Gonzalez | 101,712 | 57.31 | |
| Republican | Tim Westley | 66,877 | 37.68 | |
| Green | Vanessa S. Tijerina | 5,448 | 3.07 | |
| Libertarian | Ross Lynn Leone | 3,442 | 1.94 | |
| Total votes | 177,479 | 100.0 | ||
| Democratic hold | ||||
2018
| Party | Candidate | Votes | % | |
|---|---|---|---|---|
| Democratic | Vicente Gonzalez | 98,333 | 59.07 | |
| Republican | Tim Westley | 63,862 | 38.07 | |
| Libertarian | Anthony Cristo | 2,607 | 1.06 | |
| Total votes | 164,802 | 100.0 | ||
| Democratic hold | ||||
Historical district boundaries

References
- https://www.census.gov/geo/maps-data/data/cd_state.html
- https://www.census.gov/mycd/?st=48&cd=15
- https://www.census.gov/mycd/?st=48&cd=15
- "Partisan Voting Index – Districts of the 115th Congress" (PDF). The Cook Political Report. April 7, 2017. Retrieved April 7, 2017.
- 1920 election results
- 1922 election results
- 1924 election results
- 1926 election results
- 1928 election results
- 1930 election results
- 1932 election results
- 1934 election results
- 1936 election results
- 1938 election results
- 1940 election results
- 1942 election results
- 1944 election results
- 1946 election results
- 1948 election results
- 1950 election results
- 1952 election results
- 1954 election results
- 1956 election results
- 1958 election results
- 1960 election results
- 1962 election results
- 1964 election results
- 1966 election results
- 1968 election results
- 1970 election results
- 1972 election results
- 1974 election results
- 1976 election results
- 1978 election results
- 1980 election results
- 1982 election results
- 1984 election results
- 1986 election results
- 1988 election results
- 1990 election results
- 1992 election results
- 1994 election results
- 1996 election results
- 1998 election results
- 2000 election results
- 2002 election results
- 2004 election results
- 2006 election results
- 2008 election results
- 2010 election results
- 2012 election results
- 2014 election results
- 2016 election results
- Martis, Kenneth C. (1989). The Historical Atlas of Political Parties in the United States Congress. New York: Macmillan Publishing Company.
- Martis, Kenneth C. (1982). The Historical Atlas of United States Congressional Districts. New York: Macmillan Publishing Company.
- Congressional Biographical Directory of the United States 1774–present
| U.S. House of Representatives | ||
|---|---|---|
| Preceded by Ohio's 1st congressional district |
Home district of the Speaker of the U.S. House of Representatives December 7, 1931 – March 4, 1933 |
Succeeded by Illinois's 20th congressional district |