New York's 11th congressional district
New York's 11th congressional district is a congressional district for the United States House of Representatives in New York City. The 11th district includes all of Staten Island and parts of southern Brooklyn, including the neighborhoods of Bay Ridge, Bath Beach, Dyker Heights, south western Gravesend, western Sheepshead Bay, and parts of southern Bensonhurst.
| New York's 11th congressional district | |||
|---|---|---|---|
.tif.png) New York 's 11th congressional district since January 3, 2013 | |||
| Representative |
| ||
| Distribution |
| ||
| Population (2010) | 717,708[1] | ||
| Median income | $72,633[2] | ||
| Ethnicity | |||
| Cook PVI | R+3[3] | ||
Politically, it is the most conservative district in New York City, the only district in the city which leans towards the Republican Party in national elections. It was the only district in the city carried by Donald Trump, who won it with 53 percent of the vote; Trump's next-best showing in a New York City district was 36 percent. Until 2018, it was the only district covering part of the city to be represented by a Republican. Following the 2018 election, the Republicans were left without House representation in New York City for only the second time since the 1930s. The district has significant Italian-American, Jewish, Irish-American, and Russian-American populations.
From 2003 to 2013, the 11th district was located entirely in Brooklyn and had a majority African-American population. Most of the territory located within the old 11th district is now located in New York's 9th congressional district. Prior to 2013, most of the territory currently located in the 11th district had been located in New York's 13th congressional district. The 11th district was the subject of The Colbert Report's Better Know a District segment on December 15, 2005 and September 4, 2012.
The 11th District is currently represented by Democrat Max Rose.[4]
Recent election results
| Election results from presidential races | ||
|---|---|---|
| Year | Office | Results |
| 1992 | President | Clinton |
| 1996 | President | Clinton |
| 2000 | President | Gore |
| 2004 | President | Kerry |
| 2008 | President | Obama |
| 2012 | President | Obama 52 - 47% |
| 2016 | President | Trump 54 - 44% |
List of members representing the district
| Representative | Party | Years | Cong ress |
Electoral history | Geography |
|---|---|---|---|---|---|
| District created | 1803 | ||||
| Beriah Palmer | Democratic-Republican | March 4, 1803 – March 3, 1805 |
8th | Elected in 1802. Retired. |
1803–1811 Clinton, Essex and Saratoga counties |
 Peter Sailly |
Democratic-Republican | March 4, 1805 – March 3, 1807 |
9th | Elected in 1804. Retired. | |
| John Thompson | Democratic-Republican | March 4, 1807 – March 3, 1809 |
10th | Elected in 1806. Redistricted to the 8th district. | |
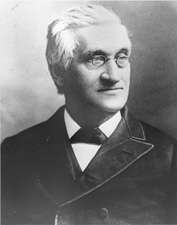
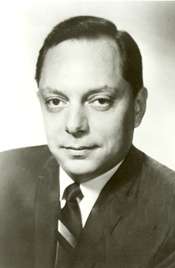
.jpg) Thomas R. Gold |
Federalist | March 4, 1809 – March 3, 1813 |
11th 12th |
Elected in 1808. Re-elected in 1810. Lost re-election. | |
| 1811–1813 Clinton, Essex, Franklin and Saratoga counties | |||||
 John W. Taylor |
Democratic-Republican | March 4, 1813 – March 3, 1823 |
13th 14th 15th 16th 17th |
Elected in 1812. Re-elected in 1814. Re-elected in 1816. Re-elected in 1818. Re-elected in 1821. Redistricted to the 17th district. |
1813–1823 Saratoga County |
| Charles A. Foote | Crawford Democratic-Republican | March 4, 1823 – March 3, 1825 |
18th | Elected in 1822. [data unknown/missing] |
1823–1833 Delaware and Greene counties |
| Henry Ashley | Jacksonian | March 4, 1825 – March 3, 1827 |
19th | Elected in 1824. Retired. | |
| Selah R. Hobbie | Jacksonian | March 4, 1827 – March 3, 1829 |
20th | Elected in 1826. Retired. | |
| Perkins King | Jacksonian | March 4, 1829 – March 3, 1831 |
21st | Elected in 1828. Retired. | |
 Erastus Root |
Jacksonian | March 4, 1831 – March 3, 1833 |
22nd | [data unknown/missing] | |
| John Cramer | Jacksonian | March 4, 1833 – March 3, 1837 |
23rd 24th |
[data unknown/missing] | 1833–1843 Schenectady and Saratoga counties |
 John I. De Graff |
Democratic | March 4, 1837 – March 3, 1839 |
25th | [data unknown/missing] Retired. | |
| Anson Brown | Whig | March 4, 1839 – June 14, 1840 |
26th | [data unknown/missing] Died. | |
| Vacant | June 14, 1840 – December 7, 1840 | ||||
| Nicholas B. Doe | Whig | December 7, 1840 – March 3, 1841 |
26th | Elected to finish Brown's term | |
| Archibald L. Linn | Whig | March 4, 1841 – March 3, 1843 |
27th | [data unknown/missing] Lost re-election by Chesselden Ellis in 16th district after redistricting | |
 Zadock Pratt |
Democratic | March 4, 1843 – March 3, 1845 |
28th | [data unknown/missing] Retired. |
1843–1853 Columbia and Greene counties |
 John F. Collin |
Democratic | March 4, 1845 – March 3, 1847 |
29th | [data unknown/missing] Retired. | |
 Peter H. Silvester |
Whig | March 4, 1847 – March 3, 1851 |
30th 31st |
[data unknown/missing] Retired. | |
 Josiah Sutherland |
Democratic | March 4, 1851 – March 3, 1853 |
32nd | [data unknown/missing] Retired. | |
 Theodoric R. Westbrook |
Democratic | March 4, 1853 – March 3, 1855 |
33rd | [data unknown/missing] Retired. |
1853–1863 Ulster County, New York and Greene County, New York |
| Rufus H. King | Opposition | March 4, 1855 – March 3, 1857 |
34th | [data unknown/missing] Retired. | |
 William F. Russell |
Democratic | March 4, 1857 – March 3, 1859 |
35th | [data unknown/missing] Retired; subsequently appointed Naval Officer of the Port of New York | |
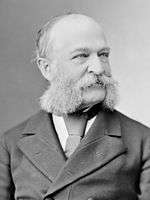
.jpg) William S. Kenyon |
Republican | March 4, 1859 – March 3, 1861 |
36th | [data unknown/missing] Retired. | |
 John B. Steele |
Democratic | March 4, 1861 – March 3, 1863 |
37th | [data unknown/missing] Redistricted to the 13th district. | |
 Charles H. Winfield |
Democratic | March 4, 1863 – March 3, 1867 |
38th 39th |
[data unknown/missing] Retired. |
1863–1873 Orange and Sullivan counties |
 Charles Van Wyck |
Republican | March 4, 1867 – March 3, 1869 |
40th | [data unknown/missing] Lost re-election by George W. Greene | |
 George W. Greene |
Democratic | March 4, 1869 – February 17, 1870 |
41st | Replaced by Charles H. Van Wyck, who successfully contested election | |
Charles Van Wyck |
Republican | February 17, 1870 – March 3, 1871 |
41st | Successfully challenged election of George W. Greene | |
 Charles St. John |
Republican | March 4, 1871 – March 3, 1873 |
42nd | [data unknown/missing] Redistricted to the 12th district. | |
 Clarkson N. Potter |
Democratic | March 4, 1873 – March 3, 1875 |
43rd | Redistricted from the 10th district. | 1873–1875 Bronx and Westchester County |
 Benjamin A. Willis |
Democratic | March 4, 1875 – March 3, 1879 |
44th 45th |
[data unknown/missing] | 1873–1883 Harlem and central Manhattan |
 Levi P. Morton |
Republican | March 4, 1879 – March 21, 1881 |
46th 47th |
[data unknown/missing] Resigned to become US Minister to France | |
| Vacant | March 21, 1881 – November 8, 1881 | ||||
 Roswell P. Flower |
Democratic | November 8, 1881 – March 3, 1883 |
47th | Elected to finish Morton's term. [data unknown/missing] | |
 Orlando B. Potter |
Democratic | March 4, 1883 – March 3, 1885 |
48th | [data unknown/missing] | 1883–1893 West Central Manhattan |
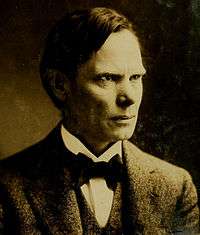
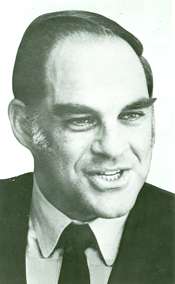
.jpg) Truman A. Merriman |
Independent Democrat | March 4, 1885 – March 3, 1887 |
49th 50th |
[data unknown/missing] | |
| Democratic | March 4, 1887 – March 3, 1889 | ||||
 John Quinn |
Democratic | March 4, 1889 – March 3, 1891 |
51st | [data unknown/missing] | |
 John De Witt Warner |
Democratic | March 4, 1891 – March 3, 1893 |
52nd | [data unknown/missing] Redistricted to the 13th district. | |
 Amos J. Cummings |
Democratic | March 4, 1893 – November 21, 1894 |
53rd | Redistricted from the 9th district Redistricted to the 10th district. |
1893–1903 Lower East Side of Manhattan (part) |
 William Sulzer |
Democratic | March 4, 1895 – March 3, 1903 |
54th 55th 56th 57th |
[data unknown/missing] Redistricted to the 10th district. | |
 William Randolph Hearst |
Democratic | March 4, 1903 – March 3, 1907 |
58th 59th |
[data unknown/missing] | 1903–1913 Part of Central west Manhattan |
 Charles V. Fornes |
Democratic | March 4, 1907 – March 3, 1913 |
60th 61st 62nd |
[data unknown/missing] | |
 Daniel J. Riordan |
Democratic | March 4, 1913 – April 28, 1923 |
63rd 64th 65th 66th 67th 68th |
Redistricted from the 8th district and re-elected in 1912. Died. |
1913–1933 All of Staten Island, Parts of Manhattan |
| Vacant | April 28, 1923 – November 6, 1923 | ||||
 Anning Smith Prall |
Democratic | November 6, 1923 – January 3, 1935 |
68th 69th 70th 71st 72nd 73rd |
Elected to finish Riordan's term. [data unknown/missing] | |
 James A. O'Leary |
Democratic | January 3, 1935 – March 16, 1944 |
74th 75th 76th 77th 78th |
[data unknown/missing] Died. | |
| Vacant | March 16, 1944 – June 6, 1944 | ||||
 Ellsworth B. Buck |
Republican | June 6, 1944 – January 3, 1945 |
78th | Elected to finish O'Leary's term. Redistricted to the 16th district. | |
 James J. Heffernan |
Democratic | January 3, 1945 – January 3, 1953 |
79th 80th 81st 82nd |
Redistricted from the 5th district. | Until 1953 Parts of Brooklyn |
 Emanuel Celler |
Democratic | January 3, 1953 – January 3, 1963 |
83rd 84th 85th 86th 87th |
Redistricted from the 15th district Redistricted to the 10th district. |
1953–1963 Parts of Brooklyn, Queens |
 Eugene J. Keogh |
Democratic | January 3, 1963 – January 3, 1967 |
88th 89th |
Redistricted from the 9th district. | 1963–1973 Parts of Brooklyn |
 Frank J. Brasco |
Democratic | January 3, 1967 – January 3, 1975 |
90th 91st 92nd 93rd |
[data unknown/missing] | |
| Until 1983 Parts of Brooklyn, Queens | |||||
 James H. Scheuer |
Democratic | January 3, 1975 – January 3, 1983 |
94th 95th 96th 97th |
[data unknown/missing] Redistricted to the 8th district. | |
 Edolphus Towns |
Democratic | January 3, 1983 – January 3, 1993 |
98th 99th 100th 101st 102nd |
[data unknown/missing] Redistricted to the 10th district. |
1983–2003 Parts of Brooklyn |
 Major Owens |
Democratic | January 3, 1993 – January 3, 2007 |
103rd 104th 105th 106th 107th 108th 109th |
Redistricted from the 12th district. Retired. | |
2003–2013 Parts of Brooklyn | |||||
 Yvette Clarke |
Democratic | January 3, 2007 – January 3, 2013 |
110th 111th 112th |
Elected in 2006. Redistricted to the 9th district. | |
 Michael Grimm |
Republican | January 3, 2013 – January 5, 2015 |
113th 114th |
Redistricted from the 13th district. Resigned. |
2013–present.tif.png) Staten Island and parts of Brooklyn |
| Vacant | January 5, 2015 – May 5, 2015 | ||||
 Dan Donovan |
Republican | May 5, 2015 – January 3, 2019. |
114th 115th |
Elected to finish Grimm's term. Lost re-election. | |
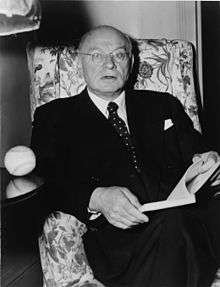
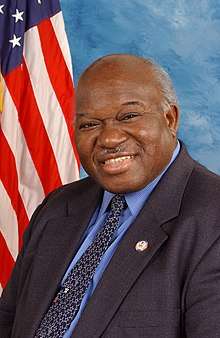
.jpg) Max Rose |
Democratic | January 3, 2019 – Present |
116th | Elected in 2018. | |
Election results
In New York State there are numerous minor parties at various points on the political spectrum. Certain parties will invariably endorse either the Republican or Democratic candidate for every office, hence the state electoral results contain both the party votes, and the final candidate votes (Listed as "Recap"). (See Electoral fusion § New York.)
| Party | Candidate | Votes | % | ± | |
|---|---|---|---|---|---|
| Democratic | Major Owens | 89,905 | 92.0 | ||
| Republican | Claudette Hayle | 7,866 | 8.0 | ||
| Majority | 82,039 | 83.9 | |||
| Turnout | 97,771 | 100 | |||
| Party | Candidate | Votes | % | ± | |
|---|---|---|---|---|---|
| Democratic | Major Owens | 75,773 | 90.0 | -2.0 | |
| Republican | David Greene | 7,284 | 8.7 | +0.7 | |
| Independence | Phyllis Taliaferro | 1,144 | 1.4 | +1.4 | |
| Majority | 68,489 | 81.3 | -2.6 | ||
| Turnout | 84,201 | 100 | -13.9 | ||
| Party | Candidate | Votes | % | ± | |
|---|---|---|---|---|---|
| Democratic | Major Owens | 112,050 | 87.0 | -3.0 | |
| Republican | Susan Cleary | 8,406 | 6.5 | -2.2 | |
| Liberal | Una S.T. Clarke | 7,366 | 5.7 | +5.7 | |
| Conservative | Cartrell Gore | 962 | 0.7 | +0.7 | |
| Majority | 103,644 | 80.5 | -0.8 | ||
| Turnout | 128,784 | 100 | +52.9 | ||
| Party | Candidate | Votes | % | ± | |
|---|---|---|---|---|---|
| Democratic | Major Owens | 76,917 | 86.6 | -0.4 | |
| Republican | Susan Cleary | 11,149 | 12.5 | +6.0 | |
| Conservative | Alice Gaffney | 798 | 0.9 | +0.2 | |
| Majority | 65,768 | 74.0 | -6.5 | ||
| Turnout | 88,864 | 100 | -31.0 | ||
| Party | Candidate | Votes | % | ± | |
|---|---|---|---|---|---|
| Democratic | Major Owens | 144,999 | 94.0 | +7.4 | |
| Independence | Lorraine Stevens | 4,721 | 3.1 | +3.1 | |
| Conservative | Sol Lieberman | 4,478 | 2.9 | +2.0 | |
| Majority | 140,278 | 91.0 | +17.0 | ||
| Turnout | 154,198 | 100 | +73.5 | ||
| Party | Candidate | Votes | % | ± | |
|---|---|---|---|---|---|
| Democratic | Yvette Clarke | 88,334 | 90.0 | -4.0 | |
| Republican | Stephen Finger | 7,447 | 7.6 | +7.6 | |
| Conservative | Marianna Blume | 1,325 | 1.4 | -1.5 | |
| Freedom | Ollie M. McClean | 996 | 1.0 | +1.0 | |
| Majority | 80,887 | 82.5 | -8.5 | ||
| Turnout | 98,102 | 100 | -36.4 | ||
| Party | Candidate | Votes | % | ± | |
|---|---|---|---|---|---|
| Democratic | Yvette Clarke | 168,562 | 92.8 | +2.8 | |
| Republican | Hugh C. Carr | 11,644 | 6.4 | -1.2 | |
| Conservative | Cartrell Gore | 1,517 | 0.8 | -0.6 | |
| Majority | 156,918 | 86.4 | +3.9 | ||
| Turnout | 181,723 | 100 | +85.2 | ||
| Party | Candidate | Votes | % | ± | |
|---|---|---|---|---|---|
| Democratic | Yvette Clarke | 104,297 | 90.6 | -2.2 | |
| Republican | Hugh C. Carr | 10,858 | 9.4 | +3.0 | |
| Majority | 93,439 | 81.1 | -5.3 | ||
| Turnout | 115,155 | 100 | -36.6 | ||
| Party | Candidate | Votes | % | ± | |
|---|---|---|---|---|---|
| Republican | Daniel M. Donovan | 23,409 | 58.7 | ||
| Democratic | Vincent Gentile | 15,808 | 39.4 | ||
| Turnout | 42,569 | 100 | |||
| Party | Candidate | Votes | % | ± | |
|---|---|---|---|---|---|
| Republican | Daniel M. Donovan | 134,366 | 62.2 | ||
| Democratic | Richard Reichard | 78,066 | 36.1 | ||
| Turnout | 216,023 | 100 | |||
| Party | Candidate | Votes | % | ± | ||
|---|---|---|---|---|---|---|
| Democratic | Max Rose | 101,823 | 53 | |||
| Republican | Daniel M. Donovan | 89,441 | 46.6 | |||
| Democratic gain from Republican | ||||||
See also
References
- "New York congressional districts by urban and rural population and land area". United States Census Bureau. June 8, 2017. Archived from the original on November 21, 2019. Retrieved November 21, 2019.
- https://www.census.gov/mycd/?st=36&cd=11
- "Partisan Voting Index – Districts of the 115th Congress" (PDF). The Cook Political Report. April 7, 2017. Retrieved April 7, 2017.
- Kashiwagi, Sydney (January 3, 2019). "It's official: Rep. Max Rose sworn in; vows to fight for the district". SILive. Retrieved January 6, 2019.
- Martis, Kenneth C. (1989). The Historical Atlas of Political Parties in the United States Congress. New York: Macmillan Publishing Company.
- Martis, Kenneth C. (1982). The Historical Atlas of United States Congressional Districts. New York: Macmillan Publishing Company.
- Congressional Biographical Directory of the United States 1774–present
- 1996 House election data, Clerk of the House of Representatives
- 1998 House election data, Clerk of the House of Representatives
- 2000 House election data, Clerk of the House of Representatives
- 2002 House election data, Clerk of the House of Representatives
- 2004 House election data, Clerk of the House of Representatives