Myrtle Beach metropolitan area
The Myrtle Beach metropolitan area (also Myrtle Beach–Conway–North Myrtle Beach MSA) is a census-designated metropolitan area consisting of Horry County in South Carolina and Brunswick County in North Carolina. The wider Myrtle Beach CSA includes Georgetown County, South Carolina . The region's primary cities, in order by population are Myrtle Beach, South Carolina; Conway, South Carolina; Leland, North Carolina; North Myrtle Beach, South Carolina and Georgetown, South Carolina. Also included is Oak Island, North Carolina with a permanent population of 6,783 (as of the 2010 census) but a summertime population of approximately 50,000.
Myrtle Beach Metropolitan Area | |
|---|---|
| Myrtle Beach–Conway–North Myrtle Beach, SC–NC | |
 | |
| Coordinates: 33°35′20″N 79°03′18″W | |
| Country | United States |
| State(s) | South Carolina, North Carolina |
| Largest city | Myrtle Beach |
| Other cities | - Conway - North Myrtle Beach - Georgetown - Loris - Shallotte - Oak Island - Leland |
| Population (2010)[1] | |
| • Total | 465,391 |
| • Rank | 126th in the U.S. |
Area
| County | 2019 Estimate | 2010 Census | Change |
|---|---|---|---|
| Horry County | 354,081 | 269,291 | +31.49% |
| Brunswick County | 142,820 | 107,431 | +32.94% |
| Georgetown County | 62,680 | 60,158 | +4.19% |
| Total | 559,581 | 436,880 | +28.09% |
2010 total does not include Brunswick County.
Largest cities and towns
| Rank | City / town | County | 2019 estimate | 2010 Census | Change |
|---|---|---|---|---|---|
| 1 | Myrtle Beach | Horry County | 34,695 | 27,109 | +27.98% |
| 2 | Conway | Horry County | 25,956 | 17,103 | +51.76% |
| 3 | Leland | Brunswick County | 23,544 | 13,527 | +74.05% |
| 4 | North Myrtle Beach | Horry County | 16,819 | 13,752 | +22.30% |
| 5 | Georgetown | Georgetown County | 8,742 | 9,163 | −4.59% |
| 6 | Oak Island | Brunswick County | 8,386 | 6,783 | +23.63% |
| 7 | Boiling Spring Lakes | Brunswick County | 6,287 | 5,372 | +17.03% |
| 8 | St. James | Brunswick County | 6,248 | 3,165 | +97.41% |
| 9 | Carolina Shores | Brunswick County | 4,659 | 3,048 | +52.85% |
| 10 | Surfside Beach | Horry County | 4,525 | 3,837 | +17.93% |
Demographics
| Year | Population | Growth | Counties Included |
|---|---|---|---|
| 1970 | 69,992 | --- | Horry, Georgetown |
| 1980 | 101,419 | 44.90% | Horry, Georgetown |
| 1990 | 144,053 | 42.04% | Horry, Georgetown |
| 2000 | 196,629 | 36.50% | Horry, Georgetown |
| 2010 | 329,449 | 67.50% | Horry, Georgetown |
| 2013 | 465,391 | 41.27% | Horry, Georgetown and Brunswick |
The estimated population of the area was 465,391 in 2013.[3]
References
- Archived October 16, 2013, at the Wayback Machine
- "Archived copy". Archived from the original on 2009-02-18. Retrieved 2009-06-21.CS1 maint: archived copy as title (link)
- "Annual Estimates of the Population of Combined Statistical Areas: April 1, 2000 to July 1, 2006 (CBSA-EST2006-02)". 2006 Population Estimates. United States Census Bureau, Population Division. 2007-04-05. Archived from the original (CSV) on 2007-09-14. Retrieved 2007-04-09.
Municipalities and communities of Horry County, South Carolina, United States | ||
|---|---|---|
| Cities |  Map of South Carolina highlighting Horry County | |
| Towns | ||
| CDPs | ||
| Unincorporated communities | ||
Municipalities and communities of Georgetown County, South Carolina, United States | ||
|---|---|---|
| City | 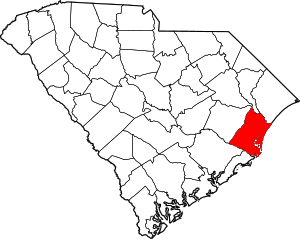 Map of South Carolina highlighting Georgetown County | |
| Towns | ||
| CDP | ||
| Unincorporated communities | ||
| Footnotes | ‡This populated place also has portions in an adjacent county or counties | |
Municipalities and communities of Brunswick County, North Carolina, United States | ||
|---|---|---|
| Cities |  | |
| Towns | ||
| Village | ||
| Townships |
| |
| Unincorporated communities | ||

This article is issued from Wikipedia. The text is licensed under Creative Commons - Attribution - Sharealike. Additional terms may apply for the media files.