Kalayaan, Laguna
Kalayaan, officially the Municipality of Kalayaan (Tagalog: Bayan ng Kalayaan), is a 3rd class municipality in the province of Laguna, Philippines. According to the 2015 census, it has a population of 23,269 people.[3]
Kalayaan | |
|---|---|
| Municipality of Kalayaan | |
 Kalayaan Plaza | |
 Seal | |
| Nickname(s): Laguna's Symbol of Peace and Unity | |
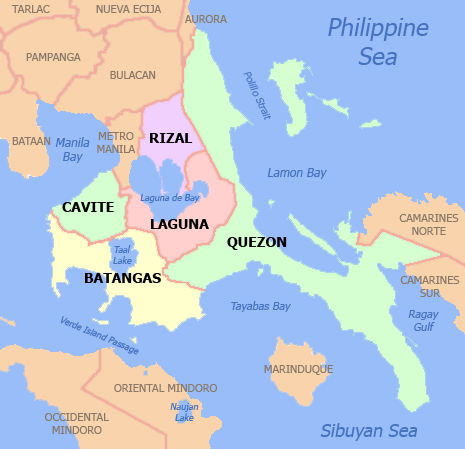
 Map of Laguna with Kalayaan highlighted | |
OpenStreetMap 
| |
.svg.png) Kalayaan Location within the Philippines | |
| Coordinates: 14°21′N 121°34′E | |
| Country | |
| Region | Calabarzon (Region IV-A) |
| Province | Laguna |
| District | 4th District |
| Founded | May 17, 1956 |
| Barangays | 3 (see Barangays) |
| Government | |
| • Type | Sangguniang Bayan |
| • Mayor | Sandy P. Laganapan |
| • Vice Mayor | John Edward Kenneth M. Ragaza |
| • Congressman | Benjamin C. Agarao Jr. |
| • Electorate | 15,910 voters (2019) |
| Area | |
| • Total | 46.60 km2 (17.99 sq mi) |
| Population (2015 census)[3] | |
| • Total | 23,269 |
| • Density | 500/km2 (1,300/sq mi) |
| • Households | 5,109 |
| Economy | |
| • Income class | 3rd municipal income class |
| • Poverty incidence | 11.86% (2015)[4] |
| • Revenue (₱) | 83,196,251.10 (2016) |
| Time zone | UTC+8 (PST) |
| ZIP code | 4015 |
| PSGC | |
| IDD : area code | +63 (0)49 |
| Climate type | tropical monsoon climate |
| Native languages | Tagalog |
| Website | www |
Kalayaan is roughly rectangular in shape, with a hilly terrain on most of its eastern side, while relatively flat on its western side. Its highest elevations are from 400 to 418 metres. These are found in Sitio Santo Angel, Malaking Pulo, and Cabuhayan in Barangay San Juan, and Sitio Lamao in Barangay San Antonio. Approximately three fourths of the total land area are with terrain 300 metres above sea level. Its lowest points are from 5 to 20 metres along the western sections of Barangays San Juan and Longos towards Laguna de Bay.
The municipality was formerly called Longos until 1956 when it was changed to its present name.[5]
Barangays
Kalayaan is politically subdivided into 3 barangays: [2]
- Longos (old capital town)
- San Antonio
- San Juan
Climate
| Climate data for Kalayaan, Laguna | |||||||||||||
|---|---|---|---|---|---|---|---|---|---|---|---|---|---|
| Month | Jan | Feb | Mar | Apr | May | Jun | Jul | Aug | Sep | Oct | Nov | Dec | Year |
| Average high °C (°F) | 24 (75) |
25 (77) |
26 (79) |
29 (84) |
29 (84) |
28 (82) |
27 (81) |
27 (81) |
27 (81) |
26 (79) |
25 (77) |
24 (75) |
26 (80) |
| Average low °C (°F) | 20 (68) |
20 (68) |
20 (68) |
21 (70) |
22 (72) |
22 (72) |
22 (72) |
22 (72) |
22 (72) |
21 (70) |
21 (70) |
20 (68) |
21 (70) |
| Average precipitation mm (inches) | 58 (2.3) |
41 (1.6) |
32 (1.3) |
29 (1.1) |
91 (3.6) |
143 (5.6) |
181 (7.1) |
162 (6.4) |
172 (6.8) |
164 (6.5) |
113 (4.4) |
121 (4.8) |
1,307 (51.5) |
| Average rainy days | 13.4 | 9.3 | 9.1 | 9.8 | 19.1 | 22.9 | 26.6 | 24.9 | 25.0 | 21.4 | 16.5 | 16.5 | 214.5 |
| Source: Meteoblue [6] | |||||||||||||
Demographics
| Year | Pop. | ±% p.a. |
|---|---|---|
| 1903 | 2,435 | — |
| 1918 | 3,103 | +1.63% |
| 1939 | 3,519 | +0.60% |
| 1948 | 3,817 | +0.91% |
| 1960 | 5,007 | +2.29% |
| 1970 | 6,957 | +3.34% |
| 1975 | 8,501 | +4.10% |
| 1980 | 10,247 | +3.81% |
| 1990 | 13,118 | +2.50% |
| 1995 | 16,955 | +4.92% |
| 2000 | 19,580 | +3.13% |
| 2007 | 21,203 | +1.10% |
| 2010 | 20,944 | −0.45% |
| 2015 | 23,269 | +2.02% |
| Source: Philippine Statistics Authority[3][7][8][9] | ||

In the 2015 census, the population of Kalayaan, Laguna, was 23,269 people,[3] with a density of 500 inhabitants per square kilometre or 1,300 inhabitants per square mile.
See also
- List of renamed cities and municipalities in the Philippines
References
- "Municipality". Quezon City, Philippines: Department of the Interior and Local Government. Retrieved 31 May 2013.
- "Province: Laguna". PSGC Interactive. Quezon City, Philippines: Philippine Statistics Authority. Retrieved 12 November 2016.
- Census of Population (2015). "Region IV-A (Calabarzon)". Total Population by Province, City, Municipality and Barangay. PSA. Retrieved 20 June 2016.
- "PSA releases the 2015 Municipal and City Level Poverty Estimates". Quezon City, Philippines. Retrieved 1 January 2020.
- Republic Act No. 1417 Archived 2012-06-01 at the Wayback Machine, PhilippineLaw, retrieved 2012
- "Kalayaan: Average Temperatures and Rainfall". Meteoblue. Retrieved 11 May 2020.
- Census of Population and Housing (2010). "Region IV-A (Calabarzon)". Total Population by Province, City, Municipality and Barangay. NSO. Retrieved 29 June 2016.
- Censuses of Population (1903–2007). "Region IV-A (Calabarzon)". Table 1. Population Enumerated in Various Censuses by Province/Highly Urbanized City: 1903 to 2007. NSO.
- "Province of Laguna". Municipality Population Data. Local Water Utilities Administration Research Division. Retrieved 17 December 2016.
External links
| Wikimedia Commons has media related to Kalayaan, Laguna. |
- Kalayaan Profile at PhilAtlas.com
- Official website
- Philippine Standard Geographic Code
- Philippine Census Information
- Local Governance Performance Management System
Places adjacent to Kalayaan, Laguna | ||||||||||
|---|---|---|---|---|---|---|---|---|---|---|
| ||||||||||
Santa Cruz (capital) | ||
| Municipalities |  | |
| Component Cities | ||
| Barangays | ||