Garfield County, Colorado
Garfield County is a county in the U.S. state of Colorado. As of the 2010 census, the population was 56,389.[1] The county seat is Glenwood Springs.[2] The county is named in honor of United States President James A. Garfield.[3] Garfield County is included in the Glenwood Springs, CO Micropolitan Statistical Area, which is also included in the Edwards-Glenwood Springs, CO Combined Statistical Area.
Garfield County | |
|---|---|
 Garfield County Courthouse | |
.png) Flag | |
 Location within the U.S. state of Colorado | |
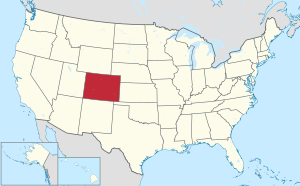 Colorado's location within the U.S. | |
| Coordinates: 39°36′N 107°54′W | |
| Country | |
| State | |
| Founded | February 10, 1883 |
| Named for | James A. Garfield |
| Seat | Glenwood Springs |
| Largest city | Glenwood Springs |
| Area | |
| • Total | 2,956 sq mi (7,660 km2) |
| • Land | 2,948 sq mi (7,640 km2) |
| • Water | 8.3 sq mi (21 km2) 0.3%% |
| Population | |
| • Estimate (2019) | 60,061 |
| • Density | 19/sq mi (7/km2) |
| Time zone | UTC−7 (Mountain) |
| • Summer (DST) | UTC−6 (MDT) |
| Congressional district | 3rd |
| Website | www |
Geography
According to the U.S. Census Bureau, the county has a total area of 2,956 square miles (7,660 km2), of which 2,948 square miles (7,640 km2) is land and 8.3 square miles (21 km2) (0.3%) is water.[4]
Adjacent counties
- Rio Blanco County - north
- Routt County - northeast
- Eagle County - east
- Pitkin County - southeast
- Mesa County - south
- Grand County, Utah - southwest
- Uintah County, Utah - northwest
Protected areas
- Flat Tops Wilderness
- Grand Mesa National Forest
- Harvey Gap State Park
- Rifle Falls State Park
- Rifle Gap State Park
- Routt National Forest
- White River National Forest
Scenic byways
- Dinosaur Diamond Prehistoric Highway National Scenic Byway
- Flat Tops Trail Scenic Byway
- West Elk Loop Scenic Byway
Demographics
| Historical population | |||
|---|---|---|---|
| Census | Pop. | %± | |
| 1890 | 4,478 | — | |
| 1900 | 5,835 | 30.3% | |
| 1910 | 10,144 | 73.8% | |
| 1920 | 9,304 | −8.3% | |
| 1930 | 9,975 | 7.2% | |
| 1940 | 10,560 | 5.9% | |
| 1950 | 11,625 | 10.1% | |
| 1960 | 12,017 | 3.4% | |
| 1970 | 14,821 | 23.3% | |
| 1980 | 22,514 | 51.9% | |
| 1990 | 29,974 | 33.1% | |
| 2000 | 43,791 | 46.1% | |
| 2010 | 56,389 | 28.8% | |
| Est. 2019 | 60,061 | [5] | 6.5% |
| U.S. Decennial Census[6] 1790-1960[7] 1900-1990[8] 1990-2000[9] 2010-2015[1] | |||
At the 2000 census there were 43,791 people, 16,229 households, and 11,279 families living in the county. The population density was 15 people per square mile (6/km²). There were 17,336 housing units at an average density of 6 per square mile (2/km²). The racial makeup of the county was 89.96% White, 0.45% Black or African American, 0.71% Native American, 0.44% Asian, 0.08% Pacific Islander, 6.53% from other races, and 1.84% from two or more races. 16.67% of the population were Hispanic or Latino of any race. 18.1% were of German, 11.1% English, 11.0% Irish, 7.1% American and 5.6% Italian ancestry according to Census 2000.[10] Of the 16,229 households 37.20% had children under the age of 18 living with them, 57.60% were married couples living together, 7.80% had a female householder with no husband present, and 30.50% were non-families. 22.80% of households were one person and 6.30% were one person aged 65 or older. The average household size was 2.65 and the average family size was 3.11.
The age distribution was 27.10% under the age of 18, 9.00% from 18 to 24, 33.00% from 25 to 44, 22.10% from 45 to 64, and 8.80% 65 or older. The median age was 34 years. For every 100 females there were 105.60 males. For every 100 females age 18 and over, there were 105.00 males.
The median household income was $47,016 and the median family income was $53,840. Males had a median income of $37,554 versus $27,280 for females. The per capita income for the county was $21,341. About 4.60% of families and 7.50% of the population were below the poverty line, including 8.10% of those under age 18 and 5.50% of those age 65 or over.
Politics
Garfield County has primarily voted for Republican Party candidates in presidential elections throughout its history, with the county only failing to back the Republican candidates six times from 1912 to the present day. Although the county includes the relatively liberal city of Glenwood Springs, this is outweighed by the extremely conservative city of Rifle, as well as the nearby towns of Silt, Parachute, and Battlement Mesa. The most recent Democratic win was by Bill Clinton in 1992, but Republicans have been held to a plurality of the county's votes in half of the six following presidential elections.
| Year | Republican | Democratic | Others |
|---|---|---|---|
| 2016 | 49.6% 13,132 | 42.6% 11,271 | 7.8% 2,067 |
| 2012 | 51.4% 12,535 | 46.3% 11,305 | 2.3% 568 |
| 2008 | 49.2% 11,359 | 49.2% 11,357 | 1.6% 366 |
| 2004 | 53.9% 11,123 | 44.7% 9,228 | 1.4% 296 |
| 2000 | 53.2% 9,103 | 35.6% 6,087 | 11.2% 1,914 |
| 1996 | 44.4% 6,281 | 40.5% 5,722 | 15.1% 2,135 |
| 1992 | 31.5% 4,404 | 36.4% 5,082 | 32.1% 4,490 |
| 1988 | 57.2% 6,358 | 41.6% 4,620 | 1.2% 136 |
| 1984 | 69.1% 7,111 | 29.9% 3,076 | 1.0% 98 |
| 1980 | 58.1% 5,416 | 28.3% 2,639 | 13.6% 1,270 |
| 1976 | 59.7% 4,699 | 36.3% 2,852 | 4.0% 315 |
| 1972 | 66.3% 4,452 | 31.1% 2,088 | 2.7% 178 |
| 1968 | 52.2% 3,157 | 37.6% 2,273 | 10.1% 613 |
| 1964 | 41.6% 2,282 | 58.2% 3,196 | 0.2% 10 |
| 1960 | 58.0% 3,215 | 41.8% 2,313 | 0.2% 11 |
| 1956 | 62.9% 3,332 | 36.9% 1,953 | 0.2% 12 |
| 1952 | 68.4% 3,914 | 31.1% 1,777 | 0.5% 28 |
| 1948 | 50.1% 2,416 | 49.0% 2,364 | 0.9% 42 |
| 1944 | 58.0% 2,588 | 41.8% 1,865 | 0.3% 11 |
| 1940 | 57.2% 2,894 | 42.3% 2,141 | 0.5% 26 |
| 1936 | 43.0% 1,945 | 53.1% 2,406 | 3.9% 177 |
| 1932 | 36.1% 1,734 | 61.3% 2,946 | 2.7% 130 |
| 1928 | 60.0% 2,435 | 38.5% 1,562 | 1.5% 59 |
| 1924 | 51.3% 1,934 | 24.3% 917 | 24.4% 921 |
| 1920 | 54.3% 1,912 | 42.3% 1,489 | 3.4% 119 |
| 1916 | 29.9% 1,139 | 65.0% 2,479 | 5.2% 197 |
| 1912 | 21.1% 824 | 46.3% 1,806 | 32.7% 1,275 |
Communities
Cities
Towns
Census-designated places
See also
References
- "State & County QuickFacts". United States Census Bureau. Archived from the original on June 6, 2011. Retrieved June 8, 2014.
- "Find a County". National Association of Counties. Archived from the original on 2011-05-31. Retrieved 2011-06-07.
- Gannett, Henry (1905). The Origin of Certain Place Names in the United States. Govt. Print. Off. pp. 134.
- "US Gazetteer files: 2010, 2000, and 1990". United States Census Bureau. 2011-02-12. Retrieved 2011-04-23.
- "Population and Housing Unit Estimates". Retrieved December 3, 2019.
- "U.S. Decennial Census". United States Census Bureau. Retrieved June 8, 2014.
- "Historical Census Browser". University of Virginia Library. Retrieved June 8, 2014.
- "Population of Counties by Decennial Census: 1900 to 1990". United States Census Bureau. Retrieved June 8, 2014.
- "Census 2000 PHC-T-4. Ranking Tables for Counties: 1990 and 2000" (PDF). United States Census Bureau. Retrieved June 8, 2014.
- "U.S. Census website". United States Census Bureau. Retrieved 2011-05-14.
- Leip, David. "Dave Leip's Atlas of U.S. Presidential Elections". uselectionatlas.org. Retrieved May 26, 2017.
External links
- Garfield County Government website
- Garfield County Statistical Data
- Colorado County Evolution by Don Stanwyck
- Colorado Historical Society
Places adjacent to Garfield County, Colorado | ||||||||||
|---|---|---|---|---|---|---|---|---|---|---|
| ||||||||||
Municipalities and communities of Garfield County, Colorado, United States | ||
|---|---|---|
| Cities | Map of Colorado highlighting Garfield County | |
| Towns | ||
| CDPs | ||
| Unincorporated communities | ||
| Authority control |
|
|---|