Economic Freedom of the World
Economic Freedom of the World is an annual survey published by the libertarian Canadian think tank Fraser Institute.[1] The survey attempts to measure the degree of economic freedom in the world's nations. It has been used in peer-reviewed studies some of which have found a range of beneficial effects of more economic freedom.[2]
| Authors | James Gwartney, Robert A. Lawson, Joshua C. Hall, Ryan Murphy, Robbie Butler, John Considine, Hugo J. Faria, Rosemarie Fike, Fred McMahon, Hugo M. Montesinos-Yufa, Dean Stansel, Meg Tuszynski[1] |
|---|---|
| Cover artist | Heather Jalbout[1] |
| Country | Canada[1] |
| Language | English, French, Spanish, Bosnian, German, Italian[1] |
| Publisher | Fraser Institute[1] |
Publication date | 2016[1] |
| ISBN | 978-0-88975-408-9 (2016 edition) |
| OCLC | 45197922 |
| LC Class | HC10 .E3746 HB95E36[1] |
| Website | freetheworld.com[1] |
History
One of the earliest measures of economic freedom was developed by Freedom House, which has done extensive work on the measurement of political and cultural freedom. This measure incorporated a range of indicators including freedom to establish a business and freedom of union organisation.[3]
Partly in response to dissatisfaction with the Freedom House index from advocates of a libertarian or market liberal viewpoint, Milton Friedman and Michael Walker of the Fraser Institute hosted a series of conferences on economic freedom. Eventually this resulted in a report on worldwide economic freedom, Economic Freedom of the World. Later the Heritage Foundation and the Wall Street Journal created another similar index, the Index of Economic Freedom.[4]
Method
The participants in the conferences reached a consensus that the cornerstones of economic freedom are: personal choice rather than collective choice, voluntary exchange coordinated by markets rather than allocation via the political process, freedom to enter and compete in markets, protection of persons and their property from aggression by others.[5] The 2005 report states "When the functions of the minimal state—protection of people and their property from the actions of aggressors, enforcement of contracts, and provision of the limited set of public goods like roads, flood control projects, and money of stable value—are performed well, but the government does little else, a country’s rating on the EFW summary index will be high. Correspondingly, as government expenditures increase and regulations expand, a country’s rating will decline."[5] In practice, the index measures: size of government (expenditures, taxes, and enterprises, legal structure), security of property rights, access to sound money, freedom to trade internationally, and regulation of credit, labor, and business.[5] The report uses 42 distinct variables, from for example the World Bank, to measure this. Some examples: tax rates, degree of juridical independence, inflation rates, costs of importing, and regulated prices. Each of the 5 areas above is given equal weight in the final score.[5]
Research
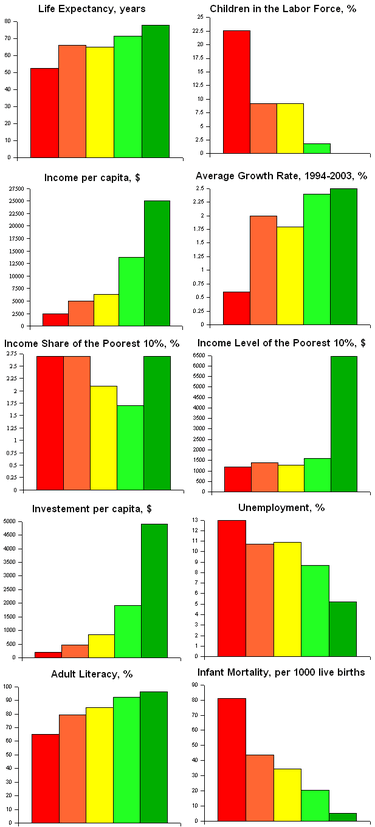
Economic freedom has been shown to correlate strongly with higher average income per person, higher income of the poorest 10%, higher life expectancy, higher literacy, lower infant mortality, higher access to water sources and less corruption. The share of income in percent going to the poorest 10% is the same for both more and less economically free countries.[6]
The people living in the top one-fifth of the most free countries enjoy an average income of $23,450 and a growth rate in the 1990s of 2.56 percent per year; in contrast, the bottom one-fifth in the rankings had an average income of just $2,556 and a -0.85 percent growth rate in the 1990s. The poorest 10 percent of the population have an average income of just $728 in the least free countries compared with over $7,000 in the most free countries. The life expectancy of people living in the most free nations is 20 years longer than for people in the least free countries.[7]
Higher economic freedom, as measured by both the Heritage and the Fraser indices, correlates strongly with higher self-reported happiness[8] and is significant in preventing wars. Economic freedom is around 54 times more effective than democracy (as measured by Democracy Score) in diminishing violent conflict.[9]
Regarding environmental health, studies have found no or a positive effect. More important may be the Kuznets curve. Most environmental health indicators, such as water and air pollution show an inverted U-shape. Meaning in the beginning of economic development, little weight is given to environmental concerns, raising pollution along with industrialization. After a threshold, when basic physical needs are met and a middle class is established, interest in a clean environment rises, reversing the trend.[10]
Studies show that more economic freedom is the cause of beneficial effects and that Economic Freedom of the World was used for most of the research, partly because Index of Economic Freedom only goes back to 1995 and because it uses more subjective variables.[10]
Influence
Hundreds of peer-reviewed articles have used the index and it has been used in economic research, political science, and environmental research.[11] The Economic Freedom of the World index has been more widely used than any other measure of economic freedom, because of its coverage of a longer time period.[12] In 2016 the report was cited in 412 independent research journals.[13] In 2016 and 2017 Free Malaysia Today and National Review quoted the report.[14]
Criticisms
The correlation between economic freedom and growth has been criticized by studies. De Haan and Siermann find that the relationship is not robust.[15] Heckelman and Stroup argue that the weighting procedure used in the construction of the index is arbitrary.[16] They examine the components of the index individually and find that many—including a low top marginal tax rate—are negatively, rather than positively correlated with economic growth. A frequent criticism is that China, and other developing nations, have high growth rates but relatively low economic freedom. Developing nations can have higher growth rates than developed nations, as they have cheap labor and can import investment, technology and organizational skills from rich countries.
When examining the subcomponents of the index, any positive effect that a low level of taxes might have is more disputed than the importance of rule of law, lack of political corruption, low inflation, and functioning property rights. Many northern European nations such as Iceland (#23), Denmark (#13), Finland (#21) and Sweden (#35), have extensive welfare states, which are strongly opposed by advocates of laissez-faire. It is argued these countries have less regulation than most others, and research using the Ease of Doing Business Index suggests that the effect of business regulations is more important than government consumption.[17] The Global Competitiveness Report looks at several other factors that affect economic growth such as infrastructure, health, and education.
Although the World Bank does not believe that laissez-faire policies, if they allow large inequalities of wealth to develop, are an effective way to achieve this goal, it is a strong supporter of the importance of economic growth for reducing poverty. It argues that an overview of many studies shows that: growth is fundamental for poverty reduction, and in principle growth as such does not seem to affect inequality, growth accompanied by a more egalitarian distribution of wealth is better than growth alone, high initial income inequality is a brake on poverty reduction, poverty itself is also likely to be a barrier for poverty reduction, and wealth inequality seems to predict lower future growth rates.[18] In 2011 the IMF Economic Review published an article that found countries with higher economic freedom and more liberal credit market regulation suffered more in output growth during the late-2000s financial crisis.[19] In 2014 a working paper published by the International Labour Organization said some of the methodology used in the Rigidity of Employment index sub-components, was not useful.[20]
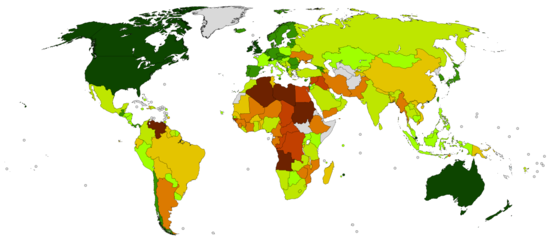
2017 ratings in 2019 Annual Report
|
>8
7.5–8
7–7.5 |
6.5–7
6–6.5
5.5–6 |
5–5.5
<5
Data unavailable |
Below are the ratings of countries for 2017, based on the 2019 Annual Report.[21] In 2017, Hong Kong and Singapore were in first and second place respectively; the next highest-scoring countries are New Zealand, Switzerland, United States, Ireland, United Kingdom, Canada, Australia and Mauritius. The lowest-scoring countries are Iraq, Republic of the Congo, Egypt, Syria, Democratic Republic of the Congo, Angola, Algeria, Sudan, Libya, and lastly, Venezuela.
| Rank | Country | Summary index |
|---|---|---|
| 1 | 8.91 | |
| 2 | 8.71 | |
| 3 | 8.50 | |
| 4 | 8.40 | |
| 5 | 8.19 | |
| 6 | 8.13 | |
| 7 | 8.09 | |
| 8 | 8.08 | |
| 9 | 8.07 | |
| 9 | 8.07 | |
| 11 | 7.97 | |
| 12 | 7.94 | |
| 13 | 7.89 | |
| 13 | 7.89 | |
| 13 | 7.89 | |
| 16 | 7.88 | |
| 17 | 7.86 | |
| 17 | 7.86 | |
| 19 | 7.85 | |
| 20 | 7.82 | |
| 21 | 7.80 | |
| 22 | 7.75 | |
| 23 | 7.74 | |
| 24 | 7.73 | |
| 25 | 7.72 | |
| 26 | 7.71 | |
| 27 | 7.70 | |
| 28 | 7.68 | |
| 28 | 7.68 | |
| 30 | 7.67 | |
| 31 | 7.66 | |
| 32 | 7.62 | |
| 33 | 7.59 | |
| 34 | 7.57 | |
| 35 | 7.56 | |
| 36 | 7.55 | |
| 37 | 7.54 | |
| 38 | 7.53 | |
| 39 | 7.52 | |
| 40 | 7.51 | |
| 40 | 7.51 | |
| 42 | 7.49 | |
| 43 | 7.44 | |
| 43 | 7.44 | |
| 45 | 7.43 | |
| 46 | 7.41 | |
| 46 | 7.41 | |
| 48 | 7.39 | |
| 49 | 7.37 | |
| 50 | 7.35 | |
| 50 | 7.35 | |
| 52 | 7.34 | |
| 53 | 7.32 | |
| 54 | 7.27 | |
| 54 | 7.27 | |
| 56 | 7.26 | |
| 56 | 7.26 | |
| 58 | 7.25 | |
| 59 | 7.24 | |
| 60 | 7.23 | |
| 61 | 7.17 | |
| 61 | 7.17 | |
| 63 | 7.16 | |
| 63 | 7.16 | |
| 65 | 7.16 | |
| 65 | 7.16 | |
| 67 | 7.15 | |
| 68 | 7.10 | |
| 69 | 7.07 | |
| 70 | 7.05 | |
| 70 | 7.05 | |
| 72 | 7.03 | |
| 73 | 7.02 | |
| 74 | 7.01 | |
| 75 | 6.97 | |
| 76 | 6.93 | |
| 77 | 6.92 | |
| 77 | 6.92 | |
| 79 | 6.91 | |
| 80 | 6.89 | |
| 81 | 6.86 | |
| 81 | 6.86 | |
| 83 | 6.84 | |
| 83 | 6.84 | |
| 85 | 6.78 | |
| 85 | 6.78 | |
| 87 | 6.77 | |
| 87 | 6.77 | |
| 89 | 6.76 | |
| 90 | 6.74 | |
| 91 | 6.70 | |
| 92 | 6.69 | |
| 92 | 6.69 | |
| 94 | 6.68 | |
| 95 | 6.67 | |
| 95 | 6.67 | |
| 97 | 6.66 | |
| 98 | 6.65 | |
| 99 | 6.64 | |
| 100 | 6.62 | |
| 101 | 6.61 | |
| 102 | 6.59 | |
| 103 | 6.58 | |
| 104 | 6.57 | |
| 105 | 6.56 | |
| 106 | 6.53 | |
| 107 | 6.52 | |
| 107 | 6.52 | |
| 109 | 6.50 | |
| 110 | 6.49 | |
| 110 | 6.49 | |
| 112 | 6.45 | |
| 113 | 6.42 | |
| 114 | 6.41 | |
| 115 | 6.36 | |
| 116 | 6.34 | |
| 117 | 6.32 | |
| 118 | 6.28 | |
| 119 | 6.27 | |
| 120 | 6.23 | |
| 121 | 6.21 | |
| 122 | 6.20 | |
| 123 | 6.18 | |
| 124 | 6.17 | |
| 124 | 6.17 | |
| 126 | 6.14 | |
| 126 | 6.14 | |
| 128 | 6.11 | |
| 129 | 6.08 | |
| 130 | 6.07 | |
| 131 | 6.06 | |
| 132 | 6.05 | |
| 133 | 5.99 | |
| 134 | 5.97 | |
| 135 | 5.96 | |
| 136 | 5.91 | |
| 136 | 5.91 | |
| 138 | 5.88 | |
| 139 | 5.86 | |
| 140 | 5.84 | |
| 140 | 5.84 | |
| 142 | 5.83 | |
| 143 | 5.72 | |
| 143 | 5.72 | |
| 145 | 5.69 | |
| 146 | 5.67 | |
| 147 | 5.63 | |
| 148 | 5.63 | |
| 149 | 5.60 | |
| 150 | 5.42 | |
| 151 | 5.23 | |
| 151 | 5.23 | |
| 153 | 5.21 | |
| 154 | 5.08 | |
| 155 | 5.05 | |
| 155 | 5.05 | |
| 157 | 5.00 | |
| 158 | 4.83 | |
| 159 | 4.77 | |
| 160 | 4.67 | |
| 161 | 4.45 | |
| 162 | 2.58 | |
Past reports
Trend
The Economic Freedom of the World 2005 report stated that the world economic freedom score has grown considerably over the last few decades. By its measure, the average score has increased from 5.17 in 1985 to 6.4. Of the nations in 1985, 95 nations increased their score, seven saw a decline, and six were unchanged.[22]
2013 ratings in 2015 Annual Report
Economic Freedom Ratings for 2013,[23] including 157 countries and 119 positions which may be shared by two or more countries.
| Rank | Country | Summary index | Previous rank [24] | Difference |
|---|---|---|---|---|
| 1 | 8.97 | 8.97 | ||
| 2 | 8.52 | 8.73 | ||
| 3 | 8.19 | 8.49 | ||
| 4 | 8.16 | 8.30 | ||
| 5 | 8.15 | 8.07 | ||
| 6 | 8.08 | 8.01 | ||
| 7 | 7.93 | 7.81 | ||
| 8 | 7.90 | 7.66 | ||
| 9 | 7.89 | 7.93 | ||
| 10 | 7.87 | 7.87 | ||
| 11 | 7.87 | 7.85 | ||
| 12 | 7.83 | 7.88 | ||
| 13 | 7.83 | 7.61 | ||
| 14 | 7.77 | 7.62 | ||
| 15 | 7.76 | 7.77 | ||
| 16 | 7.73 | 7.73 | ||
| 17 | 7.69 | 7.32 | ||
| 18 | 7.67 | 7.62 | ||
| 19 | 7.61 | 7.98 | ||
| 20 | 7.61 | 7.61 | ||
| 21 | 7.61 | 7.65 | ||
| 22 | 7.58 | 7.78 | ||
| 23 | 7.58 | 7.76 | ||
| 24 | 7.55 | 7.93 | ||
| 25 | 7.53 | 7.11 | ||
| 26 | 7.52 | 7.50 | ||
| 27 | 7.51 | 7.49 | ||
| 28 | 7.51 | 7.56 | ||
| 29 | 7.50 | 7.68 | ||
| 30 | 7.48 | 7.57 | ||
| 31 | 7.46 | 7.59 | ||
| 32 | 7.46 | 7.22 | ||
| 33 | 7.45 | 7.21 | ||
| 34 | 7.43 | 7.46 | ||
| 35 | 7.42 | 7.31 | ||
| 36 | 7.42 | 7.34 | ||
| 37 | 7.40 | 7.40 | ||
| 38 | 7.40 | 7.23 | ||
| 39 | 7.38 | 7.26 | ||
| 40 | 7.38 | 7.50 | ||
| 41 | 7.34 | 7.64 | ||
| 42 | 7.33 | 7.26 | ||
| 43 | 7.33 | 7.25 | ||
| 44 | 7.33 | 7.12 | ||
| 45 | 7.33 | 7.59 | ||
| 46 | 7.30 | 7.10 | ||
| 47 | 7.29 | 7.20 | ||
| 48 | 7.29 | 7.46 | ||
| 49 | 7.27 | 7.21 | ||
| 50 | 7.27 | 7.08 | ||
| 51 | 7.27 | 7.53 | ||
| 52 | 7.26 | 7.36 | ||
| 53 | 7.26 | 7.02 | ||
| 54 | 7.26 | 6.84 | ||
| 55 | 7.25 | 7.03 | ||
| 56 | 7.25 | 7.59 | ||
| 57 | 7.23 | 7.13 | ||
| 58 | 7.22 | 7.06 | ||
| 59 | 7.21 | 7.31 | ||
| 60 | 7.19 | 7.05 | ||
| 61 | 7.19 | 7.06 | ||
| 62 | 7.18 | 7.27 | ||
| 63 | 7.18 | 7.05 | ||
| 64 | 7.18 | 7.26 | ||
| 65 | 7.18 | 7.35 | ||
| 66 | 7.16 | 6.81 | ||
| 67 | 7.14 | 7.21 | ||
| 68 | 7.13 | 7.25 | ||
| 69 | 7.13 | 6.85 | ||
| 70 | 7.12 | 7.38 | ||
| 71 | 7.12 | 6.98 | ||
| 72 | 7.11 | 6.96 | ||
| 73 | 7.07 | N/A | - | |
| 74 | 7.07 | 6.95 | ||
| 75 | 7.03 | 7.72 | ||
| 76 | 7.01 | 6.90 | ||
| 77 | 7.01 | 7.41 | ||
| 78 | 6.98 | 6.67 | ||
| 79 | 6.97 | 6.24 | ||
| 80 | 6.97 | 7.10 | ||
| 81 | 6.95 | 7.14 | ||
| 82 | 6.92 | 6.65 | ||
| 83 | 6.92 | 7.06 | ||
| 84 | 6.91 | 7.01 | ||
| 85 | 6.87 | 6.83 | ||
| 86 | 6.87 | 7.37 | ||
| 87 | 6.86 | N/A | - | |
| 88 | 6.86 | 7.10 | ||
| 89 | 6.85 | 6.78 | ||
| 90 | 6.83 | 6.96 | ||
| 91 | 6.83 | 6.56 | ||
| 92 | 6.81 | 6.01 | ||
| 93 | 6.79 | 6.64 | ||
| 94 | 6.79 | 6.56 | ||
| 95 | 6.77 | 6.29 | ||
| 96 | 6.74 | 6.80 | ||
| 97 | 6.73 | 6.51 | ||
| 98 | 6.71 | 6.37 | ||
| 99 | 6.69 | 6.55 | ||
| 100 | 6.68 | 6.39 | ||
| 101 | 6.65 | 6.46 | ||
| 102 | 6.64 | 6.82 | ||
| 103 | 6.63 | 6.86 | ||
| 104 | 6.63 | 6.64 | ||
| 105 | 6.57 | 6.66 | ||
| 106 | 6.56 | 6.61 | ||
| 107 | 6.56 | 6.19 | ||
| 108 | 6.52 | 6.36 | ||
| 109 | 6.46 | 6.56 | ||
| 110 | 6.46 | 6.23 | ||
| 111 | 6.44 | 6.22 | ||
| 112 | 6.44 | 6.21 | ||
| 113 | 6.44 | 6.59 | ||
| 114 | 6.43 | 6.34 | ||
| 115 | 6.42 | 6.33 | ||
| 116 | 6.39 | 6.87 | ||
| 117 | 6.36 | 6.35 | ||
| 118 | 6.34 | 6.30 | ||
| 119 | 6.34 | 6.51 | ||
| 120 | 6.34 | 5.94 | ||
| 121 | 6.34 | 6.36 | ||
| 122 | 6.32 | 5.97 | ||
| 123 | 6.29 | 5.95 | ||
| 124 | 6.28 | 6.34 | ||
| 125 | 6.28 | 6.34 | ||
| 126 | 6.28 | 6.31 | ||
| 127 | 6.27 | 6.30 | ||
| 128 | 6.20 | 6.71 | ||
| 129 | 6.20 | 6.16 | ||
| 130 | 6.12 | 5.68 | ||
| 131 | 6.10 | 5.94 | ||
| 132 | 6.08 | 6.32 | ||
| 133 | 6.05 | 5.95 | ||
| 134 | 6.03 | 5.76 | ||
| 135 | 5.99 | 5.85 | ||
| 136 | 5.87 | 6.30 | ||
| 137 | 5.87 | 5.63 | ||
| 138 | 5.85 | 5.26 | ||
| 139 | 5.79 | 6.42 | ||
| 140 | 5.79 | 5.60 | ||
| 141 | 5.72 | 5.73 | ||
| 142 | 5.71 | 5.57 | ||
| 143 | 5.68 | 5.47 | ||
| 144 | 5.65 | 5.28 | ||
| 145 | 5.62 | N/A | - | |
| 146 | 5.56 | 4.08 | ||
| 147 | 5.43 | 6.05 | ||
| 148 | 5.37 | 5.17 | ||
| 149 | 5.33 | 4.59 | ||
| 150 | 5.29 | 5.26 | ||
| 151 | 5.20 | 5.32 | ||
| 152 | 5.20 | 5.69 | ||
| 153 | 5.19 | N/A | - | |
| 154 | 5.13 | 4.98 | ||
| 155 | 5.11 | N/A | - | |
| 156 | 4.72 | 4.57 | ||
| 157 | 3.23 | 3.93 |
Related indices
A related index for Chinese provinces is followed by both Chinese scholars and policy makers. There is also a network of institutions in 59 different nations that use the index to promote free market ideas.[25]
See also
- Indices of economic freedom
- List of indices of freedom
- List of countries by economic freedom
- List of countries by inequality-adjusted HDI (Human Development Index)
References
- Gwartney, James; Lawson, Robert A.; Hall, Joshua C.; Murphy, Ryan; Butler, Robbie; Considine, John; Faria, Hugo J.; Fike, Rosemarie; McMahon, Fred; Montesinos-Yufa, Hugo M.; Stansel, Dean; Tuszynski, Meg (Sep 15, 2016). Economic Freedom of the World: 2016 Annual Report. Fraser Institute. ISBN 978-0-88975-408-9. OCLC 45197922.; ISSN 1482-471X; OCLC 773250104
- "Published Work Using Economic Freedom of the World Research". Archived from the original on 2011-03-20.
- "Cuba After Fidel – What Next?". Voice of America. October 31, 2009. Archived from the original on October 14, 2012. Retrieved October 13, 2012.
- "Moroccan Liberalization Making Progress". Financial Tribune Daily. April 30, 2017. Retrieved 1 May 2017.
- Dolan, Ed (April 27, 2017). "Quality of Government, Not Size, Is the Key to Freedom and Prosperity". Niskanen Center. Retrieved 1 May 2017.
- Economic Freedom of the World: 2004 Annual Report (PDF). 2004. Archived from the original (PDF) on March 16, 2016.
- Lawson, Robert A. (July 1, 2002). "Economic Freedom Needed To Alleviate Poverty". Archived from the original on October 6, 2006.
- In Pursuit of Happiness Research. Is It Reliable? What Does It Imply for Policy? Archived 2011-02-19 at the Wayback Machine The Cato institute. April 11, 2007
- Chapter2: Economic Freedom and Peace Archived 2008-10-16 at the Wayback Machine, Economic Freedom of the World 2005
- Berggren, Niclas. The Benefits of Economic Freedom: A Survey (PDF). The Ratio Institute. SSRN 888503. Archived from the original (PDF) on June 4, 2007.
- Hundreds of peer-reviewed articles: "Economic Freedom". Google Scholar. Retrieved 5 May 2017.Dexter, S. "Published Work Using Economic Freedom of the World Research". Archived from the original on Jan 29, 2000.
- Dawson, John W. (May 2007). "The Empirical Institution-Growth Literature: Is Something Amiss at the Top?". 4 (Issue 2). pp. 184–96.
- "Citations in 2016 Professional Literature of the Fraser Institute's Economic Freedom Research" (PDF). Fraser Institute. pp. 1–36. Retrieved 2 April 2017.
- See:Wan, Saiful Wan Jan (March 29, 2017). "Wrong to oversimplify China's investments". Free Malaysia Today. Archived from the original on Mar 29, 2017.Tanner, Michael (September 21, 2016). "In Comparative Economic Freedom, the U.S. Is in 16th Place". National Review. Archived from the original on September 22, 2016.
- Further Evidence on the Relationship Between Economic Freedom and Economic Growth, Public Choice. 95: 363–80.
- Jac C. Heckelman, Michael D. Stroup (2000), ‘Which Economic Freedoms Contribute to Growth?’, Kyklos, 53(4), 527–44.
- "Knowledge Resources". World Bank.
- "The Poverty-Growth-Inequality Link". World Bank.
- Giannone, Domenico; Lenza, Michele; Reichlin, Lucrezia (2011). "Market Freedom and the Global Recession". IMF Economic Review. 59 (1).
- Aleksynska, Mariya; Cazes, Sandrine (2014). "Comparing indicators of labour market regulations across databases: A post scriptum to the employing workers debate" (pdf). Conditions of Work and Employment Series. 50. Geneva: International Labour Office. ISSN 2226-8944. Retrieved 27 July 2017.
This paper offers a critical overview of labour market regulations’ indicators developed by the World Economic Forum, the IMD, and the Fraser Institute. [Abstract]
Cite journal requires|journal=(help) - "2019 ANNUAL REPORT: Economic Freedom of the World" (PDF). Fraser Institute. Retrieved 9 January 2020.
- Huntington, Donald M. (May 18, 2009). Advanced Seminar in Business. William Jewell College.
- "Economic Freedom of the World 2015" (PDF). Archived from the original (PDF) on 2015-09-28. Retrieved 2015-09-27.
- 2011 report published in 2013: Economic Freedom of the World in 2011 Archived 2016-03-04 at the Wayback Machine
- Gwartney, James D.; Lawson, Robert A. (September 18, 2003). The Impact of the Economic Freedom of the World Index (PDF). Mont Pelerin Society. Archived from the original (PDF) on September 7, 2003.