Demographics of Réunion
This article concerns the demography of Réunion. People of Réunion are Réunionese. The official language is French, and Réunionese Creole is widely spoken. The population of Réunion is 882,526 as of 2018.[1][2]
Population
As of 2018, estimates put the population of Réunion at 882,526, with a growth rate of 1.63%. The birth rate was estimated at 21.84 births per 1,000 population, and the death rate at 5.55 deaths per 1,000 population in the same year. The net migration rate was zero in 2000. The following table describes age structure and sex ratios in Réunion.
| Age band (years) | Percentage population | Sex ratio (male/female) |
|---|---|---|
| At birth | n/a | 1.05 |
| 0-14 | 32 | 1.05 |
| 15-64 | 62 | 0.97 |
| 65+ | 6 | 0.68 |
Structure of the population [3]
Structure of the population (01.01.2010) (Provisional estimates) :
| Age Group | Male | Female | Total | % |
|---|---|---|---|---|
| Total | 399 728 | 428 326 | 828 054 | 100 |
| 0-4 | 35 044 | 33 093 | 68 137 | 8,23 |
| 5-9 | 36 404 | 34 819 | 71 223 | 8,60 |
| 10-14 | 36 292 | 34 535 | 70 827 | 8,55 |
| 15-19 | 35 775 | 35 479 | 71 254 | 8,60 |
| 20-24 | 28 067 | 28 265 | 56 332 | 6,80 |
| 25-29 | 22 922 | 27 618 | 50 540 | 6,10 |
| 30-34 | 24 936 | 30 303 | 55 239 | 6,67 |
| 35-39 | 28 029 | 32 557 | 60 586 | 7,32 |
| 40-44 | 32 311 | 35 469 | 67 780 | 8,19 |
| 45-49 | 30 352 | 31 939 | 62 291 | 7,52 |
| 50-54 | 24 261 | 25 699 | 49 960 | 6,03 |
| 55-59 | 20 577 | 21 820 | 42 397 | 5,12 |
| 60-64 | 15 588 | 15 727 | 31 315 | 3,78 |
| 65-69 | 11 380 | 12 867 | 24 247 | 2,93 |
| 70-74 | 7 912 | 10 529 | 18 441 | 2,23 |
| 75-79 | 5 036 | 7 513 | 12 549 | 1,52 |
| 80-84 | 2 948 | 5 295 | 8 243 | 1,00 |
| 85-89 | 1 438 | 3 203 | 4 641 | 0,56 |
| 90-94 | 350 | 1 173 | 1 523 | 0,18 |
| 95+ | 106 | 423 | 529 | 0,06 |
| Age group | Male | Female | Total | Percent |
|---|---|---|---|---|
| 0-14 | 107 740 | 102 446 | 210 187 | 25,38 |
| 15-64 | 262 818 | 284 877 | 547 695 | 66,14 |
| 65+ | 29 170 | 41 003 | 70 173 | 8,47 |
Historical population
| Year | Pop. | ±% |
|---|---|---|
| 1950 | 248,000 | — |
| 1960 | 335,000 | +35.1% |
| 1970 | 462,000 | +37.9% |
| 1980 | 510,000 | +10.4% |
| 1990 | 612,000 | +20.0% |
| 2000 | 739,000 | +20.8% |
| 2010 | 846,000 | +14.5% |
| 2019 | 866,500 | +2.4% |
| Source:[4] 2019 data[5] | ||
| Year | Population | Year | Population | Year | Population | ||
|---|---|---|---|---|---|---|---|
| 1671 | 90 | 1830 | 101 300 | 1961 | 349 282 | ||
| 1696 | 269 | 1848 | 110 300 | 1967 | 416 525 | ||
| 1704 | 734 | 1849 | 120 900 | 1974 | 476 675 | ||
| 1713 | 1 171 | 1860 | 200 000 | 1982 | 515 814 | ||
| 1717 | 2 000 | 1870 | 212 000 | 1990 | 597 823 | ||
| 1724 | 12 550 | 1887 | 163 881 | 1999 | 706 300 | ||
| 1764 | 25 000 | 1897 | 173 192 | 2006 | 781 962 | ||
| 1777 | 35 100 | 1926 | 182 637 | 2007 | 790 500 | ||
| 1789 | 61 300 | 1946 | 241 708 | 2008 | 802 001 | ||
| 1826 | 87 100 | 1954 | 274 370 | ||||
| Official data from INSEE by census or estimate; estimates shown in italics. | |||||||
Vital statistics[6][7]
| Average population (x 1000) | Live births | Deaths | Natural change | Crude birth rate (per 1000) | Crude death rate (per 1000) | Natural change (per 1000) | Total fertility rate | |
|---|---|---|---|---|---|---|---|---|
| 1950 | 248 | 11 714 | 5 570 | 6 144 | 48.0 | 22.8 | 25.2 | |
| 1951 | 259 | 11 684 | 4 653 | 7 031 | 46.5 | 18.5 | 28.0 | |
| 1952 | 268 | 13 231 | 4 677 | 8 554 | 51.3 | 18.1 | 33.2 | |
| 1953 | 277 | 13 597 | 4 444 | 9 153 | 51.1 | 16.7 | 34.4 | |
| 1954 | 284 | 13 613 | 4 064 | 9 549 | 49.7 | 14.8 | 34.9 | |
| 1955 | 292 | 14 082 | 4 394 | 9 688 | 49.2 | 15.4 | 33.9 | |
| 1956 | 300 | 14 129 | 3 746 | 10 383 | 47.7 | 12.7 | 35.1 | |
| 1957 | 308 | 14 484 | 3 464 | 11 020 | 46.9 | 11.2 | 35.7 | |
| 1958 | 317 | 14 271 | 4 594 | 9 677 | 44.9 | 14.4 | 30.4 | |
| 1959 | 326 | 14 388 | 4 422 | 9 966 | 44.0 | 13.5 | 30.5 | |
| 1960 | 336 | 14 856 | 3 892 | 10 964 | 44.0 | 11.5 | 32.4 | |
| 1961 | 345 | 15 205 | 4 001 | 11 204 | 43.7 | 11.5 | 32.2 | |
| 1962 | 355 | 15 937 | 4 121 | 11 816 | 44.4 | 11.5 | 32.9 | |
| 1963 | 366 | 16 482 | 4 058 | 12 424 | 44.4 | 10.9 | 33.5 | |
| 1964 | 378 | 16 681 | 3 960 | 12 721 | 43.3 | 10.3 | 33.0 | |
| 1965 | 391 | 16 869 | 3 806 | 13 063 | 42.9 | 9.7 | 33.2 | |
| 1966 | 405 | 16 683 | 4 284 | 12 399 | 41.4 | 10.6 | 30.8 | |
| 1967 | 421 | 16 013 | 3 586 | 12 427 | 38.1 | 8.5 | 29.6 | |
| 1968 | 437 | 15 827 | 3 763 | 12 064 | 37.2 | 8.8 | 28.3 | |
| 1969 | 451 | 15 153 | 3 867 | 11 286 | 34.8 | 8.9 | 25.9 | |
| 1970 | 462 | 13 437 | 3 663 | 9 774 | 30.1 | 8.2 | 21.9 | |
| 1971 | 470 | 14 432 | 3 494 | 10 938 | 31.7 | 7.7 | 24.0 | |
| 1972 | 475 | 13 740 | 3 391 | 10 349 | 29.7 | 7.3 | 22.4 | |
| 1973 | 479 | 13 287 | 3 377 | 9 910 | 28.3 | 7.2 | 21.1 | |
| 1974 | 482 | 13 423 | 3 090 | 10 333 | 28.3 | 6.5 | 21.8 | |
| 1975 | 485 | 13 301 | 3 182 | 10 119 | 27.7 | 6.6 | 21.0 | |
| 1976 | 488 | 12 828 | 3 113 | 9 715 | 26.3 | 6.4 | 20.0 | |
| 1977 | 492 | 12 517 | 3 119 | 9 398 | 25.4 | 6.3 | 19.1 | |
| 1978 | 497 | 11 978 | 3 129 | 8 849 | 24.1 | 6.3 | 17.8 | |
| 1979 | 503 | 12 444 | 3 021 | 9 423 | 24.8 | 6.0 | 18.7 | |
| 1980 | 509 | 12 302 | 3 258 | 9 044 | 24.2 | 6.4 | 17.8 | |
| 1981 | 517 | 11 838 | 3 161 | 8 677 | 23.1 | 6.2 | 16.9 | |
| 1982 | 527 | 11 964 | 3 048 | 8 916 | 23.1 | 5.9 | 17.2 | |
| 1983 | 537 | 12 484 | 3 301 | 9 183 | 23.7 | 6.3 | 17.4 | |
| 1984 | 548 | 13 116 | 3 040 | 10 076 | 24.4 | 5.7 | 18.8 | |
| 1985 | 559 | 13 163 | 3 018 | 10 145 | 24.1 | 5.5 | 18.6 | |
| 1986 | 569 | 12 797 | 3 065 | 9 732 | 23.0 | 5.5 | 17.5 | |
| 1987 | 579 | 12 599 | 3 090 | 9 509 | 22.3 | 5.5 | 16.8 | |
| 1988 | 589 | 13 561 | 3 163 | 10 398 | 23.6 | 5.5 | 18.1 | |
| 1989 | 599 | 13 898 | 3 307 | 10 591 | 23.6 | 5.6 | 18.0 | |
| 1990 | 611 | 13 877 | 3 151 | 10 726 | 23.1 | 5.2 | 17.8 | |
| 1991 | 622 | 14 117 | 3 401 | 10 716 | 23.1 | 5.6 | 17.5 | |
| 1992 | 635 | 14 240 | 3 347 | 10 893 | 22.8 | 5.4 | 17.4 | |
| 1993 | 648 | 13 432 | 3 205 | 10 227 | 21.3 | 5.1 | 16.2 | |
| 1994 | 661 | 13 327 | 3 089 | 10 238 | 20.7 | 4.8 | 15.9 | |
| 1995 | 674 | 13 053 | 3 135 | 9 918 | 19.9 | 4.8 | 15.1 | |
| 1996 | 686 | 13 047 | 3 565 | 9 482 | 19.5 | 5.3 | 14.2 | |
| 1997 | 699 | 13 712 | 3 553 | 10 159 | 20.1 | 5.2 | 14.9 | |
| 1998 | 712 | 13 538 | 3 731 | 9 807 | 19.5 | 5.4 | 14.2 | |
| 1999 | 724 | 14 153 | 3 825 | 10 328 | 20.0 | 5.4 | 14.6 | 2.33 |
| 2000 | 736 | 14 594 | 3 836 | 10 758 | 20.2 | 5.3 | 14.9 | 2.51 |
| 2001 | 748 | 14 541 | 3 829 | 10 712 | 19.8 | 5.2 | 14.6 | 2.45 |
| 2002 | 759 | 14 789 | 4 004 | 10 785 | 19.8 | 5.4 | 14.4 | 2.41 |
| 2003 | 770 | 14 427 | 4 041 | 10 386 | 19.0 | 5.3 | 13.7 | 2.43 |
| 2004 | 780 | 14 545 | 3 958 | 10 587 | 18.9 | 5.1 | 13.8 | 2.45 |
| 2005 | 791 | 14 610 | 4 357 | 10 253 | 18.7 | 5.6 | 13.1 | 2.49 |
| 2006 | 802 | 14 495 | 4 323 | 10 172 | 18.4 | 5.5 | 12.9 | 2.44 |
| 2007 | 813 | 14 808 | 3 974 | 10 834 | 18.6 | 5.0 | 13.6 | 2.47 |
| 2008 | 823 | 14 927 | 4 115 | 10 812 | 18.4 | 5.1 | 13.4 | 2.47 |
| 2009 | 834 | 14 299 | 4 109 | 10 190 | 17.4 | 5.0 | 12.4 | 2.37 |
| 2010 | 845 | 14 147 | 4 220 | 9 927 | 17.0 | 5.1 | 11.9 | 2.36 |
| 2011 | 855 | 14 124 | 4 002 | 10 122 | 16.5 | 4.7 | 11.8 | 2.36 |
| 2012 | 865 | 14 288 | 4 167 | 10 121 | 16.5 | 4.8 | 11.7 | |
| 2013 | 845 | 14 002 | 4 258 | 9 744 | 16.6 | 5.1 | 11.5 | 2.40 |
| 2014 | 14 095 | 4 355 | 9 740 | 16.8 | 5.2 | 11.6 | ||
| 2015 | 14 011 | 4 531 | 9 480 | 16.5 | ||||
| 2016 | 857 | 13 742 | 4 685 | 9 053 | 16.1 | 5.5 | 2.43 | |
| 2017 | 862 | 13 708 | 4 673 | 9 035 | 15.9 | 5.4 | 2.43 | |
Life expectancy
At birth, life expectancy is 76.5 years for male children, and 82.9 for female (figures for 2011).[7]
Religion
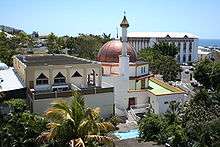
The predominant religion is Roman Catholicism with Hinduism, Islam and Buddhism also represented, among others.
Language
French is the only official language of Reunion. Although not official, Réunion Creole is also commonly spoken by the majority of the population. One can hear it in any administration or office, but education is only in French.[8]
Tamil is taught as optional language in some schools.[9] Due to the diverse population, other languages such as Mandarin, Hakka and Cantonese are also spoken by members of the Chinese community, but fewer people speak these languages as younger generations start to converse in French. The number of speakers of Indian languages (mostly Urdu and Gujarati) is also dropping sharply. Arabic is taught in mosques and spoken by a small community of Arabs.
Ethnic groups
Ethnic groups present include people of European, African, Malagasy, Indians and Chinese origin as well as many of mixed race. Local names for these are used: Yabs, Cafres, Malbars and Zarabes (both ethnic groups of Indian origin) and Chinois.
The proportion of people of each ethnicity is not known exactly, since the 1958 constitution bans questions about ethnicity in compulsory censuses in France.[10] Extensive and long-going intermarriage also blurs the issue. Whites are estimated to make up approximately one-quarter of the population, Indians also roughly a quarter, and people of Chinese ancestry to form roughly 3%. The percentages of racially mixed people and those of Afro-Malagasy origins vary wildly between estimates, though they are very few in number.[11][12][13]
People of Tamil origin make up the majority of the Indo-Réunionnais people; Gujarati, Bihari and other origins form the remainder of the population. The island's community of Muslims from modern region of Pakistan and North India and elsewhere is also commonly referred to as Zarabes.
Creoles (a name given to those born on the island, of various ethnic origins), make up the majority of the population. Groups that are not creole include people from Metropolitan France (known as Zoreilles) and those from Mayotte and the Comoros.
Genetics
In 2005, a genetic study on the racially mixed people of Réunion found the following. For maternal (mitochondrial) DNA, the haplogroups are Indian (44%), East Asian (27%), European/Middle Eastern (19%) or African (10%). The Indian lineages are M2, M6 and U2i, the East Asian ones are E1, D5a, M7c, and F (E1 and M7c also found only in South East Asia and in Madagascar), the European/Middle Eastern ones are U2e, T1, J, H, and I, and the African ones are L1b1, L2a1, L3b, and L3e1.[14]
For paternal (Y-chromosome) DNA, the haplogroups are European/Middle Eastern (85%) or East Asian (15%). The European lineages are R1b and I, the Middle Eastern one E1b1b1c (formerly E3b3) (also found in Northeast Africa), and the East Asian ones are R1a (found in many parts of the world including Europe and Central and Southern Asia but the particular sequence has been found in Asia) and O3.[14]
References
- ""World Population prospects – Population division"". population.un.org. United Nations Department of Economic and Social Affairs, Population Division. Retrieved November 9, 2019.
- ""Overall total population" – World Population Prospects: The 2019 Revision" (xslx). population.un.org (custom data acquired via website). United Nations Department of Economic and Social Affairs, Population Division. Retrieved November 9, 2019.
- "United Nations Statistics Division - Demographic and Social Statistics". unstats.un.org. Retrieved 22 August 2017.
- World Population Prospects: The 2010 Revision Archived February 28, 2013, at the Wayback Machine
- INSEE. "Estimation de population par région, sexe et grande classe d'âge - Années 1975 à 2019" (in French). Retrieved 2019-01-19.
- http://unstats.un.org/unsd/demographic/products/dyb/dyb2.htm#2001 United nations. Demographic Yearbooks
- "Insee - Population". insee.fr.
- "Ethnologue report (language code:rcf)". Ethnologue.com. Retrieved 2010-04-16.
- "NRI" (PDF). Archived from the original (PDF) on 2010-08-21. Retrieved 2010-04-16.
- Oppenheimer, David B. (2008-08-20). "SSRN-Why France Needs to Collect Data on Racial Identity - In a French Way by David Oppenheimer". Papers.ssrn.com. SSRN 1236362. Cite journal requires
|journal=(help) - Clicanoo. "La Réunion Métisse".
- Tarnus, Evelyne; Bourdon, Emmanuel (2006). "Anthropometric evaluations of body composition of undergraduate students at the University of La Réunion". Advances in Physiology Education. 30 (4): 248–253. doi:10.1152/advan.00069.2005. PMID 17108254.
- Archived February 28, 2008, at the Wayback Machine
- Gemma Berniell-Lee; Stéphanie Plaza; Elena Bosch; Francesc Calafell; Eric Jourdan; Maya Cesari; Gérard Lefranc & David Comas (2008). "Admixture and Sexual Bias in the Population Settlement of La Réunion Island (Indian Ocean)". American Journal of Physical Anthropology. WILEY-LISS, INC. 136 (1): 100–107. doi:10.1002/ajpa.20783. PMID 18186507. Archived from the original on 2013-01-05. Retrieved 2010-07-09.