Demographics of French Guiana
| Year | Pop. | ±% p.a. |
|---|---|---|
| 1790 | 14,520 | — |
| 1839 | 20,940 | +0.75% |
| 1857 | 25,561 | +1.11% |
| 1891 | 33,500 | +0.80% |
| Source: INSEE estimates | ||
| Year | Pop. | ±% p.a. |
|---|---|---|
| 1936 | 37,005 | — |
| 1946 | 25,499 | −3.66% |
| 1954 | 27,863 | +1.11% |
| 1961 | 33,505 | +2.67% |
| 1967 | 44,392 | +4.80% |
| 1974 | 55,125 | +3.14% |
| 1982 | 73,022 | +3.58% |
| 1990 | 114,678 | +5.80% |
| 1999 | 156,790 | +3.54% |
| 2009 | 224,469 | +3.65% |
| 2017 | 268,700 | +2.27% |
| Source:[1] | ||
Population
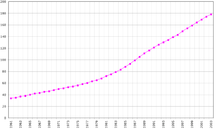
According to INSEE the population of French Guiana was 239,450 of January 1, 2012.[2] The population is very young: 44% are below the age of 20, while only 1.7% are 75 years or older. The age distribution is a reflection of the high fertility rates of French Guiana.
Nationality
On January 1, 2010, 64.5% of the population had French nationality, while 35.5% had a foreign nationality.[3] Of these, Surinamese (13.8% of the total population), Haitians (8.8%) and Brazilians (8.7%) were the largest groups. Smaller groups included people with nationality of Guyana (1.7%), Colombia (1.0%), China (0.5%), the Dominican Republic (0.4%) and Peru (0.2%).
Vital statistics
The total fertility rate in French Guiana has remained high and is today considerably higher than in metropolitan France, and also higher than the average of the French overseas departments. It is largely responsible for the high population growth of French Guiana.[4][5]
| Average population | Live births | Deaths | Natural change | Crude birth rate (per 1000) | Crude death rate (per 1000) | Natural change (per 1000) | Total fertility rate | |
|---|---|---|---|---|---|---|---|---|
| 1936 | 24,000 | 355 | 554 | -199 | 14.8 | 23.1 | -8.3 | |
| 1937 | 24,000 | 408 | 487 | -79 | 17.0 | 20.3 | -3.3 | |
| 1938 | 24,000 | 381 | 649 | -268 | 15.9 | 27.0 | -11.2 | |
| 1939 | 24,000 | 333 | 499 | -166 | 13.9 | 20.8 | -6.9 | |
| 1940 | 24,000 | 436 | 505 | -69 | 18.2 | 21.0 | -2.9 | |
| 1941 | 24,000 | 437 | 626 | -189 | 18.2 | 26.1 | -7.9 | |
| 1942 | 24,000 | 453 | 733 | -280 | 18.9 | 30.5 | -11.7 | |
| 1943 | 24,000 | 422 | 702 | -280 | 17.6 | 29.3 | -11.7 | |
| 1944 | 24,000 | 474 | 627 | -153 | 19.8 | 26.1 | -6.4 | |
| 1945 | 24,000 | 620 | 539 | 81 | 25.8 | 22.5 | 3.4 | |
| 1946 | 24,000 | 515 | 596 | -81 | 21.5 | 24.8 | -3.4 | |
| 1947 | 24,000 | 539 | 623 | -84 | 22.5 | 26.0 | -3.5 | |
| 1948 | 25,000 | 529 | 547 | -18 | 21.2 | 21.9 | -0.7 | |
| 1949 | 25,000 | 607 | 471 | 136 | 24.3 | 18.8 | 5.4 | |
| 1950 | 25,000 | 590 | 384 | 206 | 23.6 | 15.4 | 8.2 | |
| 1951 | 26,000 | 558 | 383 | 175 | 21.5 | 14.7 | 6.7 | |
| 1952 | 27,000 | 781 | 462 | 319 | 30.0 | 17.8 | 12.3 | |
| 1953 | 27,000 | 720 | 426 | 294 | 26.7 | 15.8 | 10.9 | |
| 1954 | 28,000 | 900 | 378 | 522 | 32.1 | 13.5 | 18.6 | |
| 1955 | 29,000 | 941 | 377 | 564 | 32.6 | 13.0 | 19.5 | |
| 1956 | 29,000 | 949 | 411 | 538 | 32.1 | 13.9 | 18.2 | |
| 1957 | 30,000 | 993 | 426 | 567 | 33.0 | 14.2 | 18.8 | |
| 1958 | 31,000 | 940 | 404 | 536 | 30.9 | 13.3 | 17.6 | |
| 1959 | 31,000 | 1,043 | 460 | 583 | 34.1 | 15.0 | 19.1 | |
| 1960 | 32,000 | 1,026 | 451 | 575 | 31.4 | 13.8 | 17.6 | |
| 1961 | 34,000 | 1,066 | 487 | 579 | 31.8 | 14.5 | 17.3 | |
| 1962 | 35,000 | 1,041 | 410 | 631 | 30.1 | 11.8 | 18.2 | |
| 1963 | 36,000 | 1,118 | 446 | 672 | 31.1 | 12.4 | 18.7 | |
| 1964 | 38,000 | 1,213 | 399 | 814 | 32.0 | 10.5 | 21.5 | |
| 1965 | 39,000 | 1,161 | 403 | 758 | 29.0 | 10.1 | 19.0 | |
| 1966 | 41,000 | 1,244 | 401 | 843 | 29.5 | 9.5 | 20.0 | |
| 1967 | 43,000 | 1,281 | 376 | 905 | 29.2 | 8.6 | 20.6 | |
| 1968 | 45,000 | 1,390 | 408 | 982 | 30.4 | 8.9 | 21.5 | |
| 1969 | 47,000 | 1,424 | 431 | 993 | 30.0 | 9.1 | 20.9 | |
| 1970 | 49,000 | 1,584 | 385 | 1,199 | 32.2 | 7.8 | 24.4 | |
| 1971 | 50,000 | 1,600 | 400 | 1,200 | 31.4 | 7.8 | 23.5 | |
| 1972 | 52,000 | 1,670 | 399 | 1,271 | 31.7 | 7.6 | 24.1 | |
| 1973 | 54,000 | 1,473 | 418 | 1,055 | 27.1 | 7.7 | 19.4 | |
| 1974 | 55,000 | 1,529 | 435 | 1,094 | 27.4 | 7.8 | 19.6 | |
| 1975 | 57,000 | 1,476 | 408 | 1,068 | 25.6 | 7.1 | 18.5 | |
| 1976 | 59,000 | 1,439 | 415 | 1,024 | 24.2 | 7.0 | 17.2 | |
| 1977 | 61,000 | 1,476 | 463 | 1,013 | 24.0 | 7.5 | 16.4 | |
| 1978 | 63,000 | 1,568 | 470 | 1,098 | 24.5 | 7.4 | 17.2 | |
| 1979 | 65,000 | 1,704 | 454 | 1,250 | 25.7 | 6.9 | 18.9 | |
| 1980 | 68,000 | 1,933 | 468 | 1,465 | 28.1 | 6.8 | 21.3 | |
| 1981 | 71,000 | 2,092 | 428 | 1,664 | 29.3 | 6.0 | 23.3 | |
| 1982 | 74,000 | 2,379 | 492 | 1,887 | 31.6 | 6.5 | 25.1 | |
| 1983 | 78,000 | 2,314 | 489 | 1,825 | 28.9 | 6.1 | 22.8 | |
| 1984 | 83,000 | 2,319 | 491 | 1,828 | 27.3 | 5.8 | 21.5 | |
| 1985 | 87,000 | 2,482 | 501 | 1,981 | 27.6 | 5.6 | 22.0 | |
| 1986 | 93,000 | 2,392 | 491 | 1,901 | 25.2 | 5.2 | 20.0 | |
| 1987 | 99,000 | 2,700 | 550 | 2,150 | 27.2 | 5.6 | 21.7 | |
| 1988 | 105,000 | 3,000 | 550 | 2,450 | 28.5 | 5.2 | 23.2 | |
| 1989 | 111,000 | 3,300 | 550 | 2,750 | 29.6 | 4.9 | 24.7 | |
| 1990 | 117,000 | 3,606 | 594 | 3,012 | 30.8 | 5.1 | 25.7 | |
| 1991 | 122,000 | 3,922 | 583 | 3,339 | 32.2 | 4.8 | 27.4 | |
| 1992 | 126,000 | 4,045 | 568 | 3,477 | 32.0 | 4.5 | 27.5 | |
| 1993 | 131,000 | 4,113 | 578 | 3,535 | 31.5 | 4.4 | 27.1 | |
| 1994 | 135,000 | 4,235 | 625 | 3,610 | 31.5 | 4.6 | 26.8 | |
| 1995 | 139,000 | 4,264 | 548 | 3,716 | 30.7 | 3.9 | 26.7 | |
| 1996 | 143,000 | 4,367 | 544 | 3,823 | 30.4 | 3.8 | 26.6 | |
| 1997 | 148,000 | 4,453 | 568 | 3,885 | 30.1 | 3.8 | 26.2 | |
| 1998 | 153,000 | 4,696 | 614 | 4,082 | 30.6 | 4.0 | 26.6 | |
| 1999 | 159,000 | 4,907 | 648 | 4,259 | 30.9 | 4.1 | 26.8 | 3.87 |
| 2000 | 165,000 | 5,149 | 634 | 4,515 | 31.2 | 3.8 | 27.4 | 3.93 |
| 2001 | 172,000 | 5,137 | 678 | 4,459 | 29.9 | 3.9 | 25.9 | 3.79 |
| 2002 | 179,000 | 5,276 | 665 | 4,611 | 29.4 | 3.7 | 25.7 | 3.73 |
| 2003 | 187,000 | 5,553 | 721 | 4,832 | 29.7 | 3.9 | 25.8 | 3.77 |
| 2004 | 195,000 | 5,312 | 719 | 4,593 | 27.3 | 3.7 | 23.6 | 3.47 |
| 2005 | 202,000 | 5,998 | 705 | 5,293 | 29.7 | 3.5 | 26.2 | 3.79 |
| 2006 | 208,000 | 6,276 | 711 | 5,565 | 30.1 | 3.4 | 26.7 | 3.80 |
| 2007 | 216,000 | 6,386 | 690 | 5,696 | 29.8 | 3.2 | 26.6 | 3.73 |
| 2008 | 222,000 | 6,247 | 762 | 5,485 | 28.4 | 3.5 | 24.9 | 3.57 |
| 2009 | 227,000 | 6,171 | 699 | 5,472 | 27.4 | 3.1 | 24.3 | 3.49 |
| 2010 | 233,000 | 6,083 | 773 | 5,310 | 26.3 | 3.3 | 23.0 | 3.37 |
| 2011 | 239,000 | 6,259 | 714 | 5,545 | 26.4 | 3.0 | 23.4 | 3.42 |
| 2012 | 242,000 | 6,609 | 789 | 5,820 | 27.2 | 3.2 | 23.9 | 3.60 |
| 2013 | 248,000 | 6,474 | 767 | 5,707 | 26.1 | 3.1 | 23.0 | 3.47 |
| 2014 | 255,000 | 6,591 | 786 | 5,805 | 25.9 | 3.1 | 22.8 | 3.47 |
| 2015 | 260,000 | 6,806 | 834 | 5,972 | 26.2 | 3.2 | 23.0 | 3.54 |
| 2016 | 7,270 | 901 | 6,369 | 26.9 | 3.3 | 23.6 | 3.62 | |
| 2017 | 8,057 | 964 | 7,093 | 29.4 | 3.5 | 25.9 | ||
| 2018 | 7,995 | 899 | 7,096 | 26.4 | 3.0 | 23.4 |
Structure of the population
[6] Structure of the population (01.01.2010) (Provisional estimates) :
| Age Group | Male | Female | Total | % |
|---|---|---|---|---|
| Total | 113 824 | 116 617 | 230 441 | 100 |
| 0-4 | 14 591 | 13 849 | 28 440 | 12,34 |
| 5-9 | 14 090 | 13 618 | 27 708 | 12,02 |
| 10-14 | 12 843 | 12 024 | 24 867 | 10,79 |
| 15-19 | 10 729 | 10 672 | 21 401 | 9,29 |
| 20-24 | 7 728 | 8 478 | 16 206 | 7,03 |
| 25-29 | 7 281 | 9 109 | 16 390 | 7,11 |
| 30-34 | 7 692 | 8 676 | 16 368 | 7,10 |
| 35-39 | 7 877 | 8 865 | 16 742 | 7,27 |
| 40-44 | 7 415 | 7 650 | 15 065 | 6,54 |
| 45-49 | 6 698 | 6 582 | 13 280 | 5,76 |
| 50-54 | 5 397 | 5 148 | 10 545 | 4,58 |
| 55-59 | 4 207 | 4 107 | 8 314 | 3,61 |
| 60-64 | 2 931 | 2 684 | 5 615 | 2,44 |
| 65-69 | 1 740 | 1 693 | 3 433 | 1,49 |
| 70-74 | 1 083 | 1 260 | 2 343 | 1,02 |
| 75-79 | 752 | 974 | 1 726 | 0,75 |
| 80-84 | 433 | 619 | 1 052 | 0,46 |
| 85-89 | 225 | 402 | 627 | 0,27 |
| 90-94 | 77 | 144 | 221 | 0,10 |
| 95+ | 35 | 63 | 98 | 0,04 |
| Age group | Male | Female | Total | Percent |
|---|---|---|---|---|
| 0-14 | 41 524 | 39 491 | 81 015 | 35,16 |
| 15-64 | 67 955 | 71 971 | 139 926 | 60,72 |
| 65+ | 4 345 | 5 155 | 9 500 | 4,12 |
Infant mortality rate
The infant mortality in French Guiana is higher than in metropolitan France:[7]
- 2007-2009: 12.0
- 2008-2010: 11.6
- 2009-2011: 10.1
Life expectancy
At birth, life expectancy is 76.2 years for male children, and 82.8 for female (figures for 2011).[1]
Ethnic groups
Estimates of the percentages of French Guiana ethnic composition vary, a situation compounded by the large proportion of immigrants.
Creoles, or Mulattoes (people of mixed African and French ancestry), are the largest ethnic group, though estimates vary as to the exact percentage, depending upon whether the large Haitian community is included as well. Generally the Creole population is judged to be about 60 to 70% of the total population if Haitians (comprising roughly one-third of Creoles) are included, and 30 to 50% without.
Roughly 41,000 people or 14% of the population of French Guiana is of European ancestry. The vast majority of these are of French heritage, though there are also people of Dutch, British, Spanish and Portuguese ancestry.
The main Asian communities are the Chinese (about 3-4%, primarily from Zhejiang province in mainland China and Hong Kong) and Hmong[8] from Laos (1-2%). There are also smaller groups from various Caribbean islands, mainly Saint Lucia as well as Dominica. Other Asian groups include East Indians, Lebanese and Vietnamese.
The main groups living in the interior are the Maroons (formerly called "Bush Negroes") who are from African descent, and Amerindians. The Maroons, descendants of escaped African slaves, live primarily along the Maroni River. The main Maroon groups are the Saramaka, Ndyuka (both of whom also live in Suriname), and Boni (Aluku).[8] The Maroons are the fastest growing ethnic group, and as of 2018 constitute about one-third of the total population with an estimated population of close to 100,000 people.[9]
The main Amerindian groups (estimated population about 10,000[8]) are the Arawak, Carib, Teko (previously called Emerillon), Galibi (now called the Kaliña), Palikur, Wayampi and Wayana. The estimated population for the beginning of the 17th century was 30,000 people.[10] Until the middle of the 20th century, there was a sharp decline in population to almost 1,200 people[11] in 1961 which was mainly caused by European diseases. Improved health care managed to turn the tide.[10]
Languages
French and French Guianese Creole are the most widely spoken languages. There are also several native languages, including Arawak (Arawak and Palikur), Carib (Kalina and Wayana), and Tupi-Guarani (Teko and Wayampi).[13] Other languages spoken include Hakka Chinese and Javanese.[13] The official language, like for all overseas departments and territories of France, is French.
Religion
The dominant religion of French Guiana is Roman Catholicism; some of the Maroons and Amerindian people maintain their own religions, however large tribes like the Kalina, Ndyuka have been Christianized.[14]
References
- "Résultats de la recherche - Insee". Insee.fr. Retrieved 1 August 2017.
- "Résultats de la recherche - Insee". Insee.fr. Retrieved 1 August 2017.
- "Résultats de la recherche". Insee.fr. Retrieved 1 August 2017.
- "TABLEAU P3D – INDICATEURS GÉNÉRAUX DE LA POPULATION PAR DÉPARTEMENT ET RÉGION". Insee.fr (in French). Retrieved 2017-07-09.
- "United Nations Statistics Division - Demographic and Social Statistics". Unstats.un.org. Retrieved 1 August 2017.
- "United Nations Statistics Division - Demographic and Social Statistics". Unstats.un.org. Retrieved 1 August 2017.
- "Résultats de la recherche - Insee". Insee.fr. Retrieved 1 August 2017.
- "Une population métissée". Guyane Amazonie (in French). Retrieved 5 August 2020.
- Price, Richard (2018). "Maroons in Guyane". New West Indian Guide / Nieuwe West-Indische Gids Volume 92: Issue 3-4. Brill Publishers. Retrieved 5 August 2020. Cite journal requires
|journal=(help) - Françoise Grenand and Pierre Grenand (1976). "Les amérindiens de Guyane française aujourd'hui : éléments de compréhension". Persée. Journal de la société des américanistes (in French): 363-364.
- Michotte Jean. Un pays sous-développé sous-peuplé : l'exemple de la Guyane. Institution française publique de recherche (Thesis) (in French). Université de Bordeaux. p. 57. Retrieved 5 August 2020.
- "French Guiana". Association of Religion Data Archives. 2015. Retrieved 18 May 2020.
- "French Guiana". Ethnologue.com. Retrieved 1 August 2017.
- "French Guiana". Retrieved 5 August 2020.
| Indigenous | ||
|---|---|---|
| Non-Indigenous | ||