Connecticut's 1st congressional district
Connecticut's 1st congressional district is a congressional district in the U.S. state of Connecticut. Located in the north-central part of the state, the district is anchored by the state capital of Hartford. It encompasses much of central Connecticut and includes towns within Hartford, Litchfield, and Middlesex counties.
| Connecticut's 1st congressional district | |||
|---|---|---|---|
.tif.png) Connecticut's 1st congressional district – since January 3, 2013. | |||
| Representative |
| ||
| Area | 673 sq mi (1,740 km2) | ||
| Distribution |
| ||
| Population (2017) | 710,509 | ||
| Median income | $69,766[1] | ||
| Ethnicity |
| ||
| Cook PVI | D+12[2] | ||
Principal cities include: Bristol, Hartford, and Torrington.
The district is currently represented by Democrat John Larson.
Towns in the district
Hartford County – Berlin, Bloomfield, Bristol, East Granby, East Hartford, East Windsor, Glastonbury (part), Granby, Hartford, Hartland, Manchester, Newington, Rocky Hill, Southington, South Windsor, West Hartford, Wethersfield, Windsor, and Windsor Locks.
Litchfield County – Barkhamsted, Colebrook, New Hartford, Torrington (part), and Winchester.
Middlesex County – Cromwell, Middletown (part), and Portland.
Voter registration
| Voter Registration and Party Enrollment as of October 30, 2012[3] | |||||
|---|---|---|---|---|---|
| Party | Active Voters | Inactive Voters | Total Voters | Percentage | |
| Democratic | 156,784 | 11,392 | 168,176 | 40.39% | |
| Republican | 71,932 | 3,348 | 75,280 | 18.08% | |
| Minor Parties | 301 | 29 | 330 | 0.07% | |
| Unaffiliated | 161,327 | 11,299 | 172,626 | 41.46% | |
| Total | 390,334 | 26,068 | 416,412 | 100% | |
Recent presidential elections
| Election results from presidential races | ||
|---|---|---|
| Year | Office | Results |
| 2000 | President | Gore 62–33% |
| 2004 | President | Kerry 60–39% |
| 2008 | President | Obama 66–33% |
| 2012 | President | Obama 63–36% |
| 2016 | President | Clinton 59–36% |
Recent elections
The district has the lowest Republican voter performance of the five Connecticut house seats. It has been in Democratic hands without interruption since 1957, and for all but six years since 1931.
| Party | Candidate | Votes | % | ± | |
|---|---|---|---|---|---|
| Democratic | Barbara B. Kennelly (inc.) | 176,463 | 77% | ||
| Republican | Mario Robles, Jr. | 51,985 | 23% | ||
| Democratic hold | Swing | ||||
| Turnout | 228,448 | 100% | |||
| Party | Candidate | Votes | % | ± | |
|---|---|---|---|---|---|
| Democratic | Barbara B. Kennelly (inc.) | 126,566 | 71% | ||
| Republican | James P. Garvey | 50,690 | 29% | ||
| Democratic hold | Swing | ||||
| Turnout | 177,256 | 100% | |||
| Party | Candidate | Votes | % | ± | |
|---|---|---|---|---|---|
| Democratic | Barbara B. Kennelly (inc.) | 164,735 | 67% | ||
| Republican | Phillip Steele | 75,113 | 31% | ||
| Concerned Citizens | Gary Garneau | 5,577 | 2% | ||
| Democratic hold | Swing | ||||
| Turnout | 245,425 | 100% | |||
| Party | Candidate | Votes | % | ± | |
|---|---|---|---|---|---|
| Democratic | Barbara B. Kennelly (inc.) | 139,637 | 74% | ||
| Republican | Douglas T. Putnam | 46,865 | 24% | ||
| Concerned Citizens | John F. Forry, III | 3,405 | 2% | ||
| Democratic hold | Swing | ||||
| Turnout | 188,907 | 100% | |||
| Party | Candidate | Votes | % | ± | |
|---|---|---|---|---|---|
| Democratic | Barbara B. Kennelly (inc.) | 158,222 | 74% | ||
| Republican | Kent Sleath | 53,666 | 24% | ||
| Concerned Citizens | John F. Forry, III | 2,099 | 1% | ||
| Natural Law | Daniel A. Wasielewski | 1,149 | 1% | ||
| Democratic hold | Swing | ||||
| Turnout | 215,136 | 100% | |||
| Party | Candidate | Votes | % | ± | |
|---|---|---|---|---|---|
| Democratic | John B. Larson | 97,681 | 58% | ||
| Republican | Kevin O'Connor | 69,668 | 41% | ||
| Term Limits | Jay E. Palmieri, IV | 915 | 1% | ||
| Democratic hold | Swing | ||||
| Turnout | 168,264 | 100% | |||
| Party | Candidate | Votes | % | ± | |
|---|---|---|---|---|---|
| Democratic | John B. Larson (inc.) | 151,932 | 72% | ||
| Republican | Robert Backlund | 59,331 | 28% | ||
| Democratic hold | Swing | ||||
| Turnout | 211,263 | 100% | |||
| Party | Candidate | Votes | % | ± | |
|---|---|---|---|---|---|
| Democratic | John B. Larson (inc.) | 134,698 | 67% | ||
| Republican | Phil Steele | 66,968 | 33% | ||
| Democratic hold | Swing | ||||
| Turnout | 201,666 | 100% | |||
| Party | Candidate | Votes | % | ± | |
|---|---|---|---|---|---|
| Democratic | John B. Larson (inc.) | 197,964 | 73% | ||
| Republican | John Halstead | 73,272 | 27% | ||
| Democratic hold | Swing | ||||
| Turnout | 271,237 | 100% | |||
| Party | Candidate | Votes | % | ± | |
|---|---|---|---|---|---|
| Democratic | John B. Larson (inc.) | 154,539 | 74% | ||
| Republican | Scott MacLean | 53,010 | 26% | ||
| Democratic hold | Swing | ||||
| Turnout | 207,549 | 100% | |||
| Party | Candidate | Votes | % | ± | |
|---|---|---|---|---|---|
| Democratic | John B. Larson (inc.) | 211,563 | 72% | ||
| Republican | Joe Visconti | 76,851 | 26% | ||
| Green | Stephen Fournier | 7,199 | 2% | ||
| Democratic hold | Swing | ||||
| Turnout | 295,613 | 100% | |||
| Party | Candidate | Votes | % | ± | |
|---|---|---|---|---|---|
| Democratic | John B. Larson (inc.) | 138,440 | 61% | ||
| Republican | Ann Brickley | 84,076 | 37% | ||
| Green | Kenneth J. Krayeske | 2,564 | 1% | ||
| Socialist Action | Christopher Hutchinson | 955 | 0.42% | ||
| Democratic hold | Swing | ||||
| Turnout | 226,035 | 100% | |||
| Party | Candidate | Votes | % | ± | |
|---|---|---|---|---|---|
| Democratic | John B. Larson (inc.) | 206,575 | 70% | ||
| Republican | John Henry Decker | 82,262 | 28% | ||
| Green | Michael DeRosa | 5,746 | 2% | ||
| Democratic hold | Swing | ||||
| Turnout | 294,583 | 100% | |||
| Party | Candidate | Votes | % | ± | |
|---|---|---|---|---|---|
| Democratic | John B. Larson (inc.) | 135,825 | 62% | ||
| Republican | Matthew Corey | 78,609 | 36% | ||
| Green | Jeff Russell | 3,447 | 2% | ||
| Democratic hold | Swing | ||||
| Turnout | 217,881 | 100% | |||
| Party | Candidate | Votes | % | ± | |
|---|---|---|---|---|---|
| Democratic | John B. Larson (inc.) | 188,286 | 64% | ||
| Republican | Matthew Corey | 100,976 | 34% | ||
| Green | Mike De Rosa | 6,031 | 2% | ||
| Democratic hold | Swing | ||||
| Turnout | 295,293 | 100% | |||
| Party | Candidate | Votes | % | ± | |
|---|---|---|---|---|---|
| Democratic | John B. Larson (inc.) | 175,087 | 63% | ||
| Republican | Jennifer Nye | 96,024 | 35% | ||
| Green | Tom McCormick | 3,029 | 1% | ||
| Democratic hold | Swing | ||||
| Turnout | 274,140 | 100% | |||
List of members representing the district
| Member | Party | Years | Cong ress |
Electoral history |
|---|---|---|---|---|
 Isaac Toucey |
Democratic | March 4, 1837 – March 3, 1839 |
25th | Redistricted from the at-large district and re-elected in 1837. Lost re-election. |
 Joseph Trumbull |
Whig | March 4, 1839 – March 3, 1843 |
26th 27th |
[data unknown/missing] Retired. |
 Thomas H. Seymour |
Democratic | March 4, 1843 – March 3, 1845 |
28th | [data unknown/missing] Retired. |
 James Dixon |
Whig | March 4, 1845 – March 3, 1849 |
29th 30th |
[data unknown/missing] Retired. |
.jpg) Loren P. Waldo |
Democratic | March 4, 1849 – March 3, 1851 |
31st | [data unknown/missing] Lost re-election. |
.jpg) Charles Chapman |
Whig | March 4, 1851 – March 3, 1853 |
32nd | [data unknown/missing] Retired to run for Governor. |
.jpg) James T. Pratt |
Democratic | March 4, 1853 – March 3, 1855 |
33rd | [data unknown/missing] Lost re-election. |
 Ezra Clark Jr. |
American | March 4, 1855 – March 3, 1857 |
34th 35th |
[data unknown/missing] Lost re-election. |
| Republican | March 4, 1857 – March 3, 1859 | |||
 Dwight Loomis |
Republican | March 4, 1859 – March 3, 1863 |
36th 37th |
[data unknown/missing] Retired. |
 Henry C. Deming |
Republican | March 4, 1863 – March 3, 1867 |
38th 39th |
[data unknown/missing] Lost re-election. |
.jpg) Richard D. Hubbard |
Democratic | March 4, 1867 – March 3, 1869 |
40th | [data unknown/missing] Retired. |
| Julius L. Strong | Republican | March 4, 1869 – September 7, 1872 |
41st 42nd |
[data unknown/missing] Died. |
| Vacant | September 7, 1872 – December 2, 1872 |
42nd | ||
 Joseph Roswell Hawley |
Republican | December 2, 1872 – March 3, 1875 |
42nd 43rd |
Elected to finish Strong's term. Lost re-election. |
 George M. Landers |
Democratic | March 4, 1875 – March 3, 1879 |
44th 45th |
[data unknown/missing] Retired. |
Joseph Roswell Hawley |
Republican | March 4, 1879 – March 3, 1881 |
46th | [data unknown/missing] Retired when elected to the US Senate |
 John R. Buck |
Republican | March 4, 1881 – March 3, 1883 |
47th | [data unknown/missing] Lost re-election. |
 William W. Eaton |
Democratic | March 4, 1883 – March 3, 1885 |
48th | [data unknown/missing] Lost re-election. |
John R. Buck |
Republican | March 4, 1885 – March 3, 1887 |
49th | [data unknown/missing] Lost re-election. |
 Robert J. Vance |
Democratic | March 4, 1887 – March 3, 1889 |
50th | [data unknown/missing] Lost re-election. |
 William E. Simonds |
Republican | March 4, 1889 – March 3, 1891 |
51st | [data unknown/missing] Lost re-election. |
 Lewis Sperry |
Democratic | March 4, 1891 – March 3, 1895 |
52nd 53rd |
[data unknown/missing] Lost re-election. |
.jpg) E. Stevens Henry |
Republican | March 4, 1895 – March 3, 1913 |
54th 55th 56th 57th 58th 59th 60th 61st 62nd |
[data unknown/missing] Retired. |
 Augustine Lonergan |
Democratic | March 4, 1913 – March 3, 1915 |
63rd | [data unknown/missing] Lost re-election. |
 P. Davis Oakey |
Republican | March 4, 1915 – March 3, 1917 |
64th | [data unknown/missing] Lost re-election. |
Augustine Lonergan |
Democratic | March 4, 1917 – March 3, 1921 |
65th 66th |
[data unknown/missing] Retired to run for U.S. Senator. |
 E. Hart Fenn |
Republican | March 4, 1921 – March 3, 1931 |
67th 68th 69th 70th 71st |
[data unknown/missing] Retired. |
Augustine Lonergan |
Democratic | March 4, 1931 – March 3, 1933 |
72nd | [data unknown/missing] Retired when elected to the US Senate |
 Herman P. Kopplemann |
Democratic | March 4, 1933 – January 3, 1939 |
73rd 74th 75th |
[data unknown/missing] Lost re-election. |
 William J. Miller |
Republican | January 3, 1939 – January 3, 1941 |
76th | [data unknown/missing] Lost re-election. |
Herman P. Kopplemann |
Democratic | January 3, 1941 – January 3, 1943 |
77th | [data unknown/missing] Lost re-election. |
William J. Miller |
Republican | January 3, 1943 – January 3, 1945 |
78th | [data unknown/missing] Lost re-election. |
Herman P. Kopplemann |
Democratic | January 3, 1945 – January 3, 1947 |
79th | [data unknown/missing] Lost re-election. |
William J. Miller |
Republican | January 3, 1947 – January 3, 1949 |
80th | [data unknown/missing] Lost re-election. |
 Abraham Ribicoff |
Democratic | January 3, 1949 – January 3, 1953 |
81st 82nd |
[data unknown/missing] Retired to run for U.S. Senator. |
 Thomas J. Dodd |
Democratic | January 3, 1953 – January 3, 1957 |
83rd 84th |
[data unknown/missing] Retired to run for U.S. Senator. |
.jpg) Edwin H. May Jr. |
Republican | January 3, 1957 – January 3, 1959 |
85th | [data unknown/missing] Lost re-election. |
 Emilio Q. Daddario |
Democratic | January 3, 1959 – January 3, 1971 |
86th 87th 88th 89th 90th 91st |
[data unknown/missing] Retired to run for Governor. |
 William R. Cotter |
Democratic | January 3, 1971 – September 8, 1981 |
92nd 93rd 94th 95th 96th 97th |
[data unknown/missing] Died. |
| Vacant | September 9, 1981 – January 11, 1982 |
97th | ||
 Barbara B. Kennelly |
Democratic | January 12, 1982 – January 3, 1999 |
97th 98th 99th 100th 101st 102nd 103rd 104th 105th |
Elected to finish Cotter's term. Retired to run for Governor. |
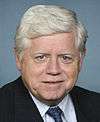 John B. Larson |
Democratic | January 3, 1999 – Present |
106th 107th 108th 109th 110th 111th 112th 113th 114th 115th 116th |
Elected in 1998. |

References
- https://www.census.gov/mycd/?st=09&cd=01
- "Partisan Voting Index – Districts of the 115th Congress" (PDF). The Cook Political Report. April 7, 2017. Retrieved April 7, 2017.
- "Registration and Party Enrollment Statistics as of October 30, 2012" (PDF). Connecticut Secretary of State. Archived from the original (PDF) on September 23, 2006. Retrieved October 30, 2012.
- Martis, Kenneth C. (1989). The Historical Atlas of Political Parties in the United States Congress. New York: Macmillan Publishing Company.
- Martis, Kenneth C. (1982). The Historical Atlas of United States Congressional Districts. New York: Macmillan Publishing Company.
- Congressional Biographical Directory of the United States 1774–present