Castle Dale, Utah
Castle Dale is a city in northwestern Emery County, Utah, United States. The population was 1,630 at the 2010 census.[5] It is the county seat of Emery County.[6]

Castle Dale, Utah | |
|---|---|
 Castle Dale's city hall | |
 Location within Emery County and the State of Utah | |
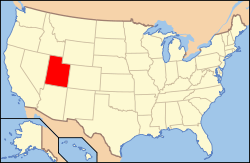 Location of Utah in the United States | |
| Coordinates: 39°12′57″N 111°1′15″W | |
| Country | United States |
| State | Utah |
| County | Emery |
| Settled | 1877 |
| Incorporated | 1920 |
| Area | |
| • Total | 2.23 sq mi (5.79 km2) |
| • Land | 2.23 sq mi (5.79 km2) |
| • Water | 0.00 sq mi (0.00 km2) |
| Elevation | 5,676 ft (1,730 m) |
| Population (2010) | |
| • Total | 1,630 |
| • Estimate (2019)[2] | 1,491 |
| • Density | 667.41/sq mi (257.71/km2) |
| Time zone | UTC-7 (Mountain (MST)) |
| • Summer (DST) | UTC-6 (MDT) |
| ZIP code | 84513 |
| Area code(s) | 435 |
| FIPS code | 49-10660[3] |
| GNIS feature ID | 1426380[4] |
| Website | www |
History
The first settlement at Castle Dale was made in 1879.[7]
Geography
Castle Dale lies on the north side of Cottonwood Creek, a tributary of the San Rafael River, in Castle Valley.
According to the United States Census Bureau, the city has a total area of 2.2 square miles (5.6 km2), all of it land.[5]
Utah State Route 10 passes through the center of town, leading northeast 31 miles (50 km) to Price and southwest 37 miles (60 km) to Interstate 70.
Demographics
| Historical population | |||
|---|---|---|---|
| Census | Pop. | %± | |
| 1890 | 505 | — | |
| 1900 | 559 | 10.7% | |
| 1910 | 693 | 24.0% | |
| 1920 | 715 | 3.2% | |
| 1930 | 713 | −0.3% | |
| 1940 | 841 | 18.0% | |
| 1950 | 715 | −15.0% | |
| 1960 | 617 | −13.7% | |
| 1970 | 541 | −12.3% | |
| 1980 | 1,910 | 253.0% | |
| 1990 | 1,704 | −10.8% | |
| 2000 | 1,657 | −2.8% | |
| 2010 | 1,630 | −1.6% | |
| Est. 2019 | 1,491 | [2] | −8.5% |
| U.S. Decennial Census[8] | |||
As of the census[3] of 2000 there were 1,657 people, 508 households, and 420 families residing in the city. The population density was 887.5 people per square mile (342.1/km2). There were 618 housing units at an average density of 331.0 per square mile (127.6/km2). The racial makeup of the city was 95.47% White, 0.06% African American, 0.66% Native American, 0.54% Asian, 0.18% Pacific Islander, 0.91% from other races, and 2.17% from two or more races. Hispanic or Latino of any race were 2.17% of the population.
There were 508 households, out of which 49.2% had children under the age of 18 living with them, 72.6% were married couples living together, 7.1% had a female householder with no husband present, and 17.3% were non-families. 15.6% of all households were made up of individuals, and 7.9% had someone living alone who was 65 years of age or older. The average household size was 3.22 and the average family size was 3.60.
In the city, the population was spread out, with 37.2% under the age of 18, 9.7% from 18 to 24, 23.5% from 25 to 44, 21.5% from 45 to 64, and 8.1% who were 65 years of age or older. The median age was 28 years. For every 100 females, there were 105.8 males. For every 100 females age 18 and over, there were 100.4 males.
The median income for a household in the city was $44,185, and the median income for a family was $48,603. Males had a median income of $40,515 versus $20,294 for females. The per capita income for the city was $14,175. About 6.7% of families and 9.5% of the population were below the poverty line, including 12.4% of those under age 18 and 5.6% of those age 65 or over.
Climate
| Climate data for Castle Dale, UT | |||||||||||||
|---|---|---|---|---|---|---|---|---|---|---|---|---|---|
| Month | Jan | Feb | Mar | Apr | May | Jun | Jul | Aug | Sep | Oct | Nov | Dec | Year |
| Record high °F (°C) | 67 (19) |
70 (21) |
83 (28) |
89 (32) |
97 (36) |
104 (40) |
107 (42) |
103 (39) |
97 (36) |
88 (31) |
78 (26) |
67 (19) |
107 (42) |
| Average high °F (°C) | 35.2 (1.8) |
41.9 (5.5) |
53.2 (11.8) |
62.5 (16.9) |
72.2 (22.3) |
82.8 (28.2) |
88.5 (31.4) |
85.8 (29.9) |
77.6 (25.3) |
65.2 (18.4) |
50.1 (10.1) |
37.9 (3.3) |
62.7 (17.1) |
| Average low °F (°C) | 6.7 (−14.1) |
14.3 (−9.8) |
23.5 (−4.7) |
30.7 (−0.7) |
38.6 (3.7) |
46.5 (8.1) |
53.4 (11.9) |
51.3 (10.7) |
42.1 (5.6) |
31.5 (−0.3) |
20.4 (−6.4) |
10.7 (−11.8) |
30.8 (−0.7) |
| Record low °F (°C) | −34 (−37) |
−35 (−37) |
−7 (−22) |
5 (−15) |
13 (−11) |
25 (−4) |
29 (−2) |
30 (−1) |
19 (−7) |
3 (−16) |
−10 (−23) |
−28 (−33) |
−35 (−37) |
| Average precipitation inches (mm) | 0.60 (15) |
0.56 (14) |
0.52 (13) |
0.54 (14) |
0.64 (16) |
0.46 (12) |
0.77 (20) |
1.05 (27) |
0.87 (22) |
0.84 (21) |
0.51 (13) |
0.53 (13) |
7.89 (200) |
| Average snowfall inches (cm) | 5.9 (15) |
3.2 (8.1) |
1.3 (3.3) |
0.3 (0.76) |
0.2 (0.51) |
0 (0) |
0 (0) |
0 (0) |
0 (0) |
0.1 (0.25) |
1.0 (2.5) |
4.0 (10) |
16 (40.42) |
| Source: http://www.wrcc.dri.edu/cgi-bin/cliMAIN.pl?ut1214 | |||||||||||||
See also
- List of cities and towns in Utah
References
- "2019 U.S. Gazetteer Files". United States Census Bureau. Retrieved August 7, 2020.
- "Population and Housing Unit Estimates". United States Census Bureau. May 24, 2020. Retrieved May 27, 2020.
- "U.S. Census website". United States Census Bureau. Retrieved January 31, 2008.
- "US Board on Geographic Names". United States Geological Survey. October 25, 2007. Retrieved January 31, 2008.
- "Geographic Identifiers: 2010 Census Summary File 1 (G001): Castle Dale city, Utah". American Factfinder. U.S. Census Bureau. Archived from the original on February 13, 2020. Retrieved March 29, 2016.
- "Find a County". National Association of Counties. Archived from the original on May 31, 2011. Retrieved June 7, 2011.
- The Utah Genealogical and Historical Magazine, Volumes 9-10. 1918. p. 82.
- "Census of Population and Housing". Census.gov. Retrieved June 4, 2015.
- Emery County Daughters of Utah Pioneers. Castle Valley: A History of Emery County. 1949.
- Powell, Allan Kent. Emery County: Reflections on Its Past and Future. 1979.
- Emery County Historical Society. Emery County 1880-1980. 1981.
External links
| Wikimedia Commons has media related to Castle Dale, Utah. |
- Castle Dale City at Emery County official website
- Emery County Progress
Places adjacent to Castle Dale, Utah | ||||||||||
|---|---|---|---|---|---|---|---|---|---|---|
| ||||||||||
Municipalities and communities of Emery County, Utah, United States | ||
|---|---|---|
| Cities |  Map of Utah highlighting Emery County | |
| Towns | ||
| Unincorporated communities | ||
| Indian reservation | ||
| Ghost towns | ||
| Footnotes | ‡This populated place also has portions in an adjacent county or counties | |
| Authority control |
|
|---|