California's 38th congressional district
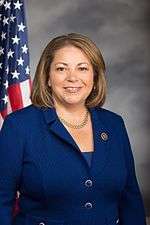
California's 38th congressional district is a congressional district in the U.S. state of California based in suburban eastern Los Angeles County and Orange County California. The district is currently represented by Democrat Linda Sánchez.
| California's 38th congressional district | |||
|---|---|---|---|
.tif.png) California's 38th congressional district since January 3, 2013.[1] | |||
| Representative |
| ||
| Median income | $72,463[2] | ||
| Ethnicity | |||
| Cook PVI | D+17[4] | ||
The district covers several cities in southeastern Los Angeles and San Gabriel Valley areas including the cities of:
- and the unincorporated communities of:
- Avocado Heights
- Los Nietos
- South San Gabriel
- East Whittier
- North Whittier
- South Whittier
The Orange County cities of La Palma and a small part of Cypress is also included in the district.
The major cities generally reflect a Hispanic majority, while Cerritos and La Palma have an Asian-American majority.
Competitiveness
In statewide races
| Year | Office | Results |
|---|---|---|
| 1990 | Governor[5] | Wilson 57.4% - 36.6% |
| 1992 | President[6] | Clinton 44.6% - 33.5% |
| Senator[7] | Herschensohn 46.3% - 45.1% | |
| Senator (Special)[8] | Feinstein 50.9% - 39.5% | |
| 1994 | Governor[9] | Wilson 57.3% - 38.6% |
| Senator[10] | Huffington 47.8% – 43.1% | |
| 1996 | President[11] | Clinton 52.8% - 35.8% |
| 1998 | Governor[12] | Davis 58.3% - 38.6% |
| Senator[13] | Boxer 55.1% - 41.2% | |
| 2000 | President[14] | Gore 57.9% - 37.3% |
| Senator[15] | Feinstein 59.6% - 33.3% | |
| 2002 | Governor[16] | Davis 62.3 - 28.7% |
| 2003 | Recall[17][18] | |
| Bustamante 47.1% - 37.9% | ||
| 2004 | President[19] | Kerry 65.3% - 33.6% |
| Senator[20] | Boxer 70.8% - 23.4% | |
| 2006 | Governor[21] | Angelides 58.3% - 37.1% |
| Senator[22] | Feinstein 71.9% - 23.0% | |
| 2008 | President[23] | Obama 72.3% - 26.6% |
| 2010 | Governor[24] | Brown 68.1% - 25.9% |
| Senator[25] | Boxer 67.1% - 26.4% | |
| 2012 | President[26] | Obama 64.9% - 33.0% |
| Senator[27] | Feinstein 66.6% - 33.4% | |
| 2014 | Governor[28] | Brown 59.7% – 40.3% |
| 2016 | President[29] | Clinton 67.0% - 27.4% |
| Senator[30] | Sanchez 50.9% - 49.1% | |
| 2018 | Governor[31] | Newsom 65.3% – 34.7% |
| Senator[32] | Feinstein 53.7% – 46.3% | |
| Lieutenant Governor[33][34] | Hernandez 53.9% – 46.1% | |
| Secretary of State[33][34] | Padilla 68.9% – 31.1% | |
| Controller[33][34] | Yee 69.0% – 31.0% | |
| Treasurer[33][34] | Ma 67.9% – 32.1% | |
| Attorney General[33][34] | Becerra 68.0% – 32.0% | |
| Insurance Commissioner[33][34] | Lara 60.7% – 39.3% | |
| Board of Equalization, 3rd District[34][lower-alpha 1] | Vazquez 65.5% – 34.5% | |
| Board of Equalization, 4th District[33][lower-alpha 1] | Anderson 50.6% – 49.4% |
Notes
- Note: The 3rd District of the Board of Equalization only serves the 38th congressional district in Los Angeles County. The 4th District of the Board of Equalization only serves the 38th congressional district in Orange County.
List of members representing the district
District created January 3, 1963.


.tif.png)
Election results
|
1962 • 1964 • 1966 • 1968 • 1970 • 1972 • 1974 • 1976 • 1978 • 1980 • 1982 • 1984 • 1986 • 1988 • 1990 • 1992 • 1994 • 1996 • 1998 • 2000 • 2002 • 2004 • 2006 • 2008 • 2010 • 2012 • 2014 • 2016 • 2018 • 2020 |
1962
| Party | Candidate | Votes | % | |||
|---|---|---|---|---|---|---|
| Republican | Patrick M. Martin | 68,583 | 55.9 | |||
| Democratic | Dalip Singh Saund (incumbent) | 54,022 | 44.1 | |||
| Total votes | 122,605 | 100.0 | ||||
| Republican gain from Democratic | ||||||
1964
| Party | Candidate | Votes | % | |||
|---|---|---|---|---|---|---|
| Democratic | John V. Tunney | 85,661 | 52.8 | |||
| Republican | Patrick M. Martin (incumbent) | 76,525 | 47.2 | |||
| Total votes | 162,186 | 100.0 | ||||
| Democratic gain from Republican | ||||||
1966
| Party | Candidate | Votes | % | |
|---|---|---|---|---|
| Democratic | John V. Tunney (incumbent) | 83,216 | 54.5 | |
| Republican | Robert O. Hunter | 69,444 | 45.5 | |
| Total votes | 152,660 | 100.0 | ||
| Democratic hold | ||||
1968
| Party | Candidate | Votes | % | |
|---|---|---|---|---|
| Democratic | John V. Tunney (incumbent) | 121,025 | 62.8 | |
| Republican | Robert O. Hunter | 68,196 | 35.4 | |
| American Independent | James H. Griffin | 2,415 | 1.2 | |
| Peace and Freedom | Terese A. Karmel | 1,205 | 0.6 | |
| Total votes | 192,841 | 100.0 | ||
| Democratic hold | ||||
1970
| Party | Candidate | Votes | % | |||
|---|---|---|---|---|---|---|
| Republican | Victor Veysey | 87,479 | 49.8 | |||
| Democratic | David A. Tunno | 85,684 | 48.8 | |||
| American Independent | William E. Pasley | 2,481 | 3.4 | |||
| Total votes | 175,644 | 100.0 | ||||
| Republican gain from Democratic | ||||||
1972
| Party | Candidate | Votes | % | |
|---|---|---|---|---|
| Democratic | George Brown, Jr. | 77,776 | 56.3 | |
| Republican | Howard J. Snider | 60,379 | 43.7 | |
| Total votes | 138,155 | 100.0 | ||
| Democratic hold | ||||
1974
| Party | Candidate | Votes | % | |||
|---|---|---|---|---|---|---|
| Democratic | Jerry M. Patterson | 67,299 | 54.0 | |||
| Republican | David Rehmann | 51,509 | 41.3 | |||
| American Independent | Lee R. Rayburn | 3,991 | 3.2 | |||
| Peace and Freedom | Larry B. Kallenberger | 1,851 | 1.5 | |||
| Total votes | 124,650 | 100.0 | ||||
| Democratic gain from Republican | ||||||
1976
| Party | Candidate | Votes | % | |
|---|---|---|---|---|
| Democratic | Jerry M. Patterson (incumbent) | 103,317 | 63.6 | |
| Republican | James "Jim" Combs | 59,092 | 36.4 | |
| Total votes | 162,409 | 100.0 | ||
| Democratic hold | ||||
1978
| Party | Candidate | Votes | % | |
|---|---|---|---|---|
| Democratic | Jerry M. Patterson (incumbent) | 75,471 | 58.6 | |
| Republican | Dan Goedeke | 53,298 | 41.4 | |
| Total votes | 128,769 | 100.0 | ||
| Democratic hold | ||||
1980
| Party | Candidate | Votes | % | |
|---|---|---|---|---|
| Democratic | Jerry M. Patterson (incumbent) | 91,880 | 55.5 | |
| Republican | Art Jacobson | 66,256 | 40.0 | |
| Libertarian | Charles E. "Chuck" Heiser | 7,301 | 4.5 | |
| Total votes | 165,437 | 100.0 | ||
| Democratic hold | ||||
1982
| Party | Candidate | Votes | % | |||
|---|---|---|---|---|---|---|
| Democratic | Jerry M. Patterson (incumbent) | 73,914 | 52.4 | |||
| Republican | William F. "Bill" Dohr | 61,279 | 43.4 | |||
| Libertarian | Anita K. Barr | 5,989 | 4.2 | |||
| Total votes | 141,182 | 100.0 | ||||
| Republican gain from Democratic | ||||||
1984
| Party | Candidate | Votes | % | |||
|---|---|---|---|---|---|---|
| Republican | Bob Dornan | 86,545 | 53.2 | |||
| Democratic | Jerry M. Patterson (incumbent) | 73,231 | 45.0 | |||
| Peace and Freedom | Michael Schuyles Bright | 3,021 | 1.8 | |||
| Total votes | 162,797 | 100.0 | ||||
| Republican gain from Democratic | ||||||
1986
| Party | Candidate | Votes | % | |
|---|---|---|---|---|
| Republican | Bob Dornan (incumbent) | 66,032 | 55.3 | |
| Democratic | Richard H. Robinson | 50,625 | 42.4 | |
| Libertarian | Lee Connelly | 2,807 | 2.3 | |
| Total votes | 119,464 | 100.0 | ||
| Republican hold | ||||
1988
| Party | Candidate | Votes | % | |
|---|---|---|---|---|
| Republican | Bob Dornan (incumbent) | 87,690 | 59.5 | |
| Democratic | Jerry Yudelson | 52,399 | 35.6 | |
| Libertarian | Bruce McKay | 3,733 | 2.5 | |
| Peace and Freedom | Frank German | 3,547 | 2.4 | |
| Total votes | 147,369 | 100.0 | ||
| Republican hold | ||||
1990
| Party | Candidate | Votes | % | |
|---|---|---|---|---|
| Republican | Bob Dornan (incumbent) | 60,561 | 58.1 | |
| Democratic | Barbara Jackson | 43,693 | 41.9 | |
| Total votes | 104,254 | 100.0 | ||
| Republican hold | ||||
1992
| Party | Candidate | Votes | % | |||
|---|---|---|---|---|---|---|
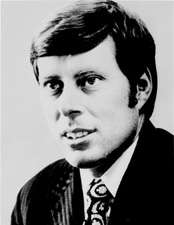
| Republican | Steve Horn | 92,038 | 48.6 | |||
| Democratic | Evan Anderson Braude | 82,108 | 43.4 | |||
| Peace and Freedom | Paul Burton | 8,391 | 4.4 | |||
| Libertarian | Blake Ashley | 6,756 | 3.6 | |||
| Independent | Brown (write-in) | 14 | 0.0 | |||
| Independent | Venable (write-in) | 14 | 0.0 | |||
| Total votes | 189,321 | 100.0 | ||||
| Republican gain from Democratic | ||||||
1994
| Party | Candidate | Votes | % | |
|---|---|---|---|---|
| Republican | Steve Horn (incumbent) | 85,225 | 58.5 | |
| Democratic | Peter Mathews | 53,681 | 36.8 | |
| Libertarian | Lester W. Mueller | 3,795 | 2.6 | |
| Peace and Freedom | Richard K. Green | 2,995 | 2.1 | |
| No party | Duke (write-in) | 73 | 0.0 | |
| Total votes | 145,769 | 100.0 | ||
| Republican hold | ||||
1996
| Party | Candidate | Votes | % | |
|---|---|---|---|---|
| Republican | Steve Horn (incumbent) | 88,136 | 52.6 | |
| Democratic | Rick Zbur | 71,627 | 42.8 | |
| Green | William Yeager | 4,610 | 2.7 | |
| Libertarian | Paul Gautreau | 3,272 | 1.9 | |
| Total votes | 195,545 | 100.0 | ||
| Republican hold | ||||
1998
| Party | Candidate | Votes | % | |
|---|---|---|---|---|
| Republican | Steve Horn (incumbent) | 88,136 | 52.9 | |
| Democratic | Peter Mathews | 71,627 | 44.3 | |
| Libertarian | David Bowers | 3,705 | 2.8 | |
| Republican | Margherita Underhill (write-in) | 17 | 0.0 | |
| Total votes | 163,485 | 100.0 | ||
| Republican hold | ||||
2000
| Party | Candidate | Votes | % | |
|---|---|---|---|---|
| Republican | Steve Horn (incumbent) | 87,266 | 48.5 | |
| Democratic | Gerrie Shcipske | 85,498 | 47.5 | |
| Natural Law | Karen Blasdell-Wilkinson | 3,744 | 2.0 | |
| Libertarian | Jack Neglia | 3,614 | 2.0 | |
| Total votes | 180,122 | 100.0 | ||
| Republican hold | ||||
2002
| Party | Candidate | Votes | % | |
|---|---|---|---|---|
| Democratic | Grace Napolitano (incumbent) | 62,600 | 71.2 | |
| Republican | Alex A. Burrola | 23,126 | 26.2 | |
| Libertarian | Al Cuperus | 2,301 | 2.6 | |
| Total votes | 88,027 | 100.0 | ||
| Democratic hold | ||||
2004
| Party | Candidate | Votes | % | |
|---|---|---|---|---|
| Democratic | Grace Napolitano (incumbent) | 116,851 | 100.0 | |
| Democratic hold | ||||
2006
| Party | Candidate | Votes | % | |
|---|---|---|---|---|
| Democratic | Grace Napolitano (incumbent) | 75,181 | 75.4 | |
| Republican | Sidney W. Street | 24,620 | 24.6 | |
| Total votes | 99,801 | 100.0 | ||
| Democratic hold | ||||
2008
| Party | Candidate | Votes | % | |
|---|---|---|---|---|
| Democratic | Grace Napolitano (incumbent) | 130,211 | 81.7 | |
| Libertarian | Christopher M. Agrella | 29,113 | 18.3 | |
| Total votes | 159,324 | 100.0 | ||
| Democratic hold | ||||
2010
| Party | Candidate | Votes | % | |
|---|---|---|---|---|
| Democratic | Grace Napolitano (incumbent) | 85,459 | 73.4 | |
| Republican | Robert Vaughn | 30,883 | 26.6 | |
| Total votes | 116,342 | 100.00 | ||
| Democratic hold | ||||
2012
| Party | Candidate | Votes | % | |
|---|---|---|---|---|
| Democratic | Linda Sánchez (incumbent) | 145,280 | 67.5 | |
| Republican | Benjamin Campos | 69,807 | 32.5 | |
| Total votes | 215,087 | 100.0 | ||
| Democratic hold | ||||
2014
| Party | Candidate | Votes | % | |
|---|---|---|---|---|
| Democratic | Linda Sánchez (incumbent) | 58,192 | 59.1 | |
| Republican | Benjamin Campos | 40,288 | 40.9 | |
| Total votes | 98,480 | 100.0 | ||
| Democratic hold | ||||
2016
| Party | Candidate | Votes | % | |
|---|---|---|---|---|
| Democratic | Linda Sánchez (incumbent) | 163,590 | 70.5 | |
| Republican | Ryan Downing | 68,524 | 29.5 | |
| Total votes | 232,114 | 100.0 | ||
| Democratic hold | ||||
2018
| Party | Candidate | Votes | % | |
|---|---|---|---|---|
| Democratic | Linda Sánchez (incumbent) | 139,188 | 68.9 | |
| Republican | Ryan Downing | 62,968 | 31.1 | |
| Total votes | 202,156 | 100.0 | ||
| Democratic hold | ||||
2020
| Party | Candidate | Votes | % | |
|---|---|---|---|---|
| Democratic | Linda Sánchez (incumbent) | |||
| Democratic | Michael Tolar | |||
| Total votes | ||||
| Democratic hold | ||||
Historical district boundaries
From 2003 through 2013, the district consisted of most of the San Gabriel Valley in Los Angeles County. Due to redistricting after the 2010 United States Census, the district has moved east and south east in Los Angeles County and includes much of the previous areas as well as Bellflower and Artesia.
References
- US Census
- US Census
- "California's citizen commission final district maps: Find out what's changed where you live". latimes.com.
- "Partisan Voting Index – Districts of the 115th Congress" (PDF). The Cook Political Report. April 7, 2017. Retrieved April 7, 2017.
- Statement of Vote (1990 Governor)
- Statement of Vote (1992 President)
- Statement of Vote (1992 Senate)
- Statement of Vote (1992 Senate)
- Statement of Vote (1994 Governor)
- Statement of Vote (1994 Senate)
- Statement of Vote (1996 President)
- Statement of Vote (1998 Governor) Archived September 29, 2011, at the Wayback Machine
- Statement of Vote (1998 Senate) Archived September 29, 2011, at the Wayback Machine
- Statement of Vote (2000 President)
- Statement of Vote (2000 Senator)
- Statement of Vote (2002 Governor)
- Statement of Vote (2003 Recall Question)
- Statement of Vote (2003 Governor)
- Statement of Vote (2004 President)
- Statement of Vote (2004 Senator)
- Statement of Vote (2006 Governor)
- Statement of Vote (2006 Senator)
- Statement of Vote (2008 President)
- Statement of Vote (2010 Governor)
- Statement of Vote (2010 Senator)
- Statement of Vote (2012 President)
- Statement of Vote (2012 Senator)
- Statement of Vote (2014 Governor)
- Statement of Vote (2016 President)
- Statement of Vote (2016 Senate)
- Statement of Vote (2018 Governor)
- Statement of Vote (2018 Senator)
- "1962 election results" (PDF).
- "1964 election results" (PDF).
- "1966 election results" (PDF).
- "1968 election results" (PDF).
- "1970 election results" (PDF).
- "1972 election results" (PDF).
- "1974 election results" (PDF).
- "1976 election results" (PDF).
- "1978 election results" (PDF).
- "1980 election results" (PDF).
- "1982 election results" (PDF).
- "1984 election results" (PDF).
- "1986 election results" (PDF).
- "1988 election results" (PDF).
- "1990 election results" (PDF).
- "1992 election results" (PDF).
- "1994 election results" (PDF).
- "1996 election results" (PDF).
- "1998 election results" (PDF).
- "2000 election results" (PDF).
- 2002 election results
- 2004 election results
- 2006 election results
- 2008 election results
- 2010 election results
- 2012 election results
- 2014 election results
- 2016 election results
- 2018 election results