California's 23rd congressional district
California's 23rd congressional district is a congressional district in the U.S. state of California.
| California's 23rd congressional district | |||
|---|---|---|---|
.tif.png) California's 23rd congressional district since January 3, 2013 | |||
| Representative |
| ||
| Population (2018 est.) | 747,852[1] | ||
| Median income | $56,995[2] | ||
| Ethnicity | |||
| Cook PVI | R+14[4] | ||
The current district includes parts of the southern San Joaquin Valley, the Tehachapi Mountains and southern Sierra Nevada, and the northwestern Mojave Desert. It comprises most of Kern County and portions of Los Angeles and Tulare counties. Cities in the district include Porterville, Ridgecrest, most of Bakersfield, and part of Lancaster.[5] By PVI, it is the most Republican-leaning district in the state.
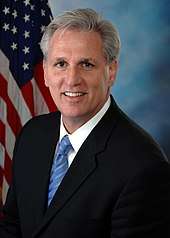
The district is represented in the 116th United States Congress by Republican Kevin McCarthy. Since January 2019, McCarthy has been House minority leader.
Former characteristics
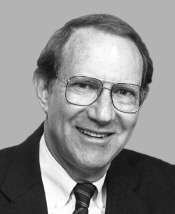
From 2003 to 2013 the district ran along the Pacific coasts of Ventura, Santa Barbara, and San Luis Obispo counties. Major cities in the district included Santa Barbara, San Luis Obispo, Ventura, and Oxnard.[6] Before redistricting by the California Citizens Redistricting Commission in 2011, California's 23rd Congressional District was one of the narrowest districts in the United States, stretching along the Pacific coast from Oxnard to the Monterey County line. It was often referred to as "the district that disappears at high tide"[7] or the "ribbon of shame".[8] This area is now divided between the 24th and 26th districts.
Election results from statewide races
| Year | Office | Results |
|---|---|---|
| 1992 | President | Clinton 38.4–34.5% |
| Senator | Herschensohn 49.4–40.6% | |
| Senator | Feinstein 46.2–45.3% | |
| 1994 | Governor | [data unknown/missing] |
| Senator | [data unknown/missing] | |
| 1996 | President | [data unknown/missing] |
| 1998 | Governor | [data unknown/missing] |
| Senator | [data unknown/missing] | |
| 2000 | President[9] | Gore 48.2–46.9% |
| Senator[10] | Feinstein 51.2–41.5% | |
| 2002 | Governor[11] | Davis 48.0–40.7% |
| 2003 | Recall[12][13] | Yes 52.8–47.2% |
| Schwarzenegger 42.4–35.2% | ||
| 2004 | President[14] | Kerry 58.3–40.3% |
| Senator[15] | Boxer 60.2–34.8% | |
| 2006 | Governor[16] | Schwarzenegger 53.6–41.1% |
| Senator[17] | Feinstein 62.3–33.1% | |
| 2008 | President[18] | Obama 65.3–32.3% |
| 2010 | Governor | Brown 55.9–38.5% |
| Senator | Boxer 55.9–38.4% | |
| 2012 | President | Romney 61.5–36.1% |
| Senator | Emken 62.0–38.0% | |
| 2014 | Governor | Kashkari 64.5–35.5% |
| 2016 | President | Trump 58.1–36.1% |
| Senator | Harris 54.3–45.7% | |
| 2018 | Governor | Cox 62.6–37.4% |
| Senator | de Leon 60.3–39.7% |
List of members representing the district

.jpg)
.jpg)


Election results
|
1942 • 1944 • 1946 • 1948 • 1950 • 1952 • 1954 • 1956 • 1958 • 1960 • 1962 • 1963 (Special) • 1964 • 1966 • 1968 • 1970 • 1972 • 1974 • 1976 • 1978 • 1980 • 1982 • 1984 • 1986 • 1988 • 1990 • 1992 • 1994 • 1996 • 1998 • 2000 • 2002 • 2004 • 2006 • 2008 • 2010 • 2012 • 2014 • 2016 • 2018 |
1942
| Party | Candidate | Votes | % | |
|---|---|---|---|---|
| Democratic | Edouard Izac (Incumbent) | 42,864 | 50.5% | |
| Republican | James B. Abbey | 42,087 | 49.5% | |
| Total votes | 84,951 | 100.0% | ||
| Turnout | ||||
| Democratic hold | ||||
1944
| Party | Candidate | Votes | % | |
|---|---|---|---|---|
| Democratic | Edouard Izac (Incumbent) | 86,707 | 55.1% | |
| Republican | James B. Abbey | 70,787 | 44.9% | |
| Total votes | 157,494 | 100.0% | ||
| Turnout | ||||
| Democratic hold | ||||
1946
| Party | Candidate | Votes | % | |||
|---|---|---|---|---|---|---|
| Republican | Charles K. Fletcher | 69,411 | 56.3% | |||
| Democratic | Edouard Izac (Incumbent) | 53,898 | 43.7% | |||
| Total votes | 123,309 | 100.0% | ||||
| Turnout | ||||||
| Republican gain from Democratic | ||||||
1948
| Party | Candidate | Votes | % | |||
|---|---|---|---|---|---|---|
| Democratic | Clinton D. McKinnon | 112,534 | 55.8% | |||
| Republican | Charles K. Fletcher (Incumbent) | 87,138 | 43.2% | |||
| Progressive | Harry C. Steinmetz | 2,017 | 1.0% | |||
| Total votes | 201,689 | 100.0% | ||||
| Turnout | ||||||
| Democratic gain from Republican | ||||||
1950
| Party | Candidate | Votes | % | |
|---|---|---|---|---|
| Democratic | Clinton D. McKinnon (Incumbent) | 94,137 | 51% | |
| Republican | Leslie E. Gehres | 90,398 | 49% | |
| Total votes | 184,535 | 100.0% | ||
| Turnout | ||||
| Democratic hold | ||||
1952
| Party | Candidate | Votes | % | |
|---|---|---|---|---|
| Democratic | Clyde Doyle (Incumbent) | 138,356 | 87.5% | |
| Progressive | Olive T. Thompson | 17,501 | 11.1% | |
| Republican | C. Cleveland (write-in) | 2,329 | 1.4% | |
| Total votes | 158,186 | 100.0% | ||
| Turnout | ||||
| Democratic hold | ||||
1954
| Party | Candidate | Votes | % | |
|---|---|---|---|---|
| Democratic | Clyde Doyle (Incumbent) | 90,729 | 70.9% | |
| Republican | Frank G. Bussing | 34,911 | 27.3% | |
| Progressive | Olive T. Thompson | 2,293 | 1.8% | |
| Total votes | 127,933 | 100.0% | ||
| Turnout | ||||
| Democratic hold | ||||
1956
| Party | Candidate | Votes | % | |
|---|---|---|---|---|
| Democratic | Clyde Doyle (Incumbent) | 120,109 | 70.9% | |
| Republican | E. Elgie "Cal" Calvin | 49,198 | 29.1% | |
| Total votes | 169,207 | 100.0% | ||
| Turnout | ||||
| Democratic hold | ||||
1958
| Party | Candidate | Votes | % | |
|---|---|---|---|---|
| Democratic | Clyde Doyle (Incumbent) | 140,817 | 100.0% | |
| Turnout | ||||
| Democratic hold | ||||
1960
| Party | Candidate | Votes | % | |
|---|---|---|---|---|
| Democratic | Clyde Doyle (Incumbent) | 148,415 | 74.2% | |
| Republican | Emmett A. Schwartz | 51,548 | 25.8% | |
| Total votes | 199,963 | 100.0% | ||
| Turnout | ||||
| Democratic hold | ||||
1962
| Party | Candidate | Votes | % | |
|---|---|---|---|---|
| Democratic | Clyde Doyle (Incumbent) | 83,269 | 64.2% | |
| Republican | Emmett A. Schwartz | 46,488 | 35.8% | |
| Total votes | 129,757 | 100.0% | ||
| Turnout | ||||
| Democratic hold | ||||
1963 (Special)
| Party | Candidate | Votes | % | |||
|---|---|---|---|---|---|---|
| Republican | Del M. Clawson | 53.2% | ||||
| Democratic | Carley V. Porter | 35.4% | ||||
| Democratic | Maurice H. Quigley | 4.7% | ||||
| Democratic | Armand R. Porter | 2.7% | ||||
| Democratic | James Earle Christo | 1.4% | ||||
| Democratic | Lynn W. Johnston | 1.4% | ||||
| Republican | Harold R. "Hal" Bennett | 0.6% | ||||
| Republican | Harry L. Butler | 0.6% | ||||
| Total votes | 100.0% | |||||
| Turnout | ||||||
| Republican gain from Democratic | ||||||
1964
| Party | Candidate | Votes | % | |
|---|---|---|---|---|
| Republican | Del M. Clawson (Incumbent) | 90,721 | 55.4% | |
| Democratic | H. O. Van Pettin | 72,903 | 44.6% | |
| Total votes | 163,624 | 100.0% | ||
| Turnout | ||||
| Republican hold | ||||
1966
| Party | Candidate | Votes | % | |
|---|---|---|---|---|
| Republican | Del M. Clawson (Incumbent) | 93,320 | 67.4% | |
| Democratic | Ed O'Connor | 45,141 | 32.6% | |
| Total votes | 138,461 | 100.0% | ||
| Turnout | ||||
| Republican hold | ||||
1968
| Party | Candidate | Votes | % | |
|---|---|---|---|---|
| Republican | Del M. Clawson (Incumbent) | 95,628 | 64.9% | |
| Democratic | Jim Sperrazzo | 51,606 | 35.1% | |
| Total votes | 147,234 | 100.0% | ||
| Turnout | ||||
| Republican hold | ||||
1970
| Party | Candidate | Votes | % | |
|---|---|---|---|---|
| Republican | Del M. Clawson (Incumbent) | 77,346 | 63.3% | |
| Democratic | G. L. "Jerry" Chapman | 44,767 | 36.7% | |
| Total votes | 122,113 | 100.0% | ||
| Turnout | ||||
| Republican hold | ||||
1972
| Party | Candidate | Votes | % | |
|---|---|---|---|---|
| Republican | Del M. Clawson (Incumbent) | 118,731 | 61.4% | |
| Democratic | Conrad G. Tuohey | 74,561 | 38.6% | |
| Total votes | 193,292 | 100.0% | ||
| Turnout | ||||
| Republican hold | ||||
1974
| Party | Candidate | Votes | % | |
|---|---|---|---|---|
| Democratic | Thomas M. Rees | 119,239 | 71.4% | |
| Republican | Jack E. Roberts | 47,615 | 28.6% | |
| Total votes | 166,854 | 100.0% | ||
| Turnout | ||||
| Democratic hold | ||||
1976
| Party | Candidate | Votes | % | |
|---|---|---|---|---|
| Democratic | Anthony C. Beilenson | 130,619 | 60.2% | |
| Republican | Thomas F. Bartman | 86,434 | 39.8% | |
| Total votes | 217,053 | 100.0% | ||
| Turnout | ||||
| Democratic hold | ||||
1978
| Party | Candidate | Votes | % | |
|---|---|---|---|---|
| Democratic | Anthony C. Beilenson (Incumbent) | 117,498 | 65.6% | |
| Republican | Joseph Barbara | 61,496 | 34.4% | |
| Total votes | 178,994 | 100.0% | ||
| Turnout | ||||
| Democratic hold | ||||
1980
| Party | Candidate | Votes | % | |
|---|---|---|---|---|
| Democratic | Anthony C. Beilenson (Incumbent) | 126,020 | 63.2% | |
| Republican | Robert "Bob" Winckler | 62,742 | 31.5% | |
| Libertarian | Jeffrey P. Lieb | 10,623 | 5.3% | |
| Total votes | 199,385 | 100.0% | ||
| Turnout | ||||
| Democratic hold | ||||
1982
| Party | Candidate | Votes | % | |
|---|---|---|---|---|
| Democratic | Anthony C. Beilenson (Incumbent) | 120,788 | 59.6% | |
| Republican | David Armor | 82,031 | 40.4% | |
| Total votes | 202,819 | 100.0% | ||
| Turnout | ||||
| Democratic hold | ||||
1984
| Party | Candidate | Votes | % | |
|---|---|---|---|---|
| Democratic | Anthony C. Beilenson (Incumbent) | 140,461 | 61.6% | |
| Republican | Claude W. Parrish | 84,093 | 36.9% | |
| Libertarian | Larry Leathers | 3,580 | 1.6% | |
| Total votes | 228,134 | 100.0% | ||
| Turnout | ||||
| Democratic hold | ||||
1986
| Party | Candidate | Votes | % | |
|---|---|---|---|---|
| Democratic | Anthony C. Beilenson (Incumbent) | 121,468 | 65.7% | |
| Republican | George Woolverton | 58,746 | 31.8% | |
| Peace and Freedom | Tom Hopke | 2,521 | 1.4% | |
| Libertarian | Taylor Rhodes | 2,019 | 1.1% | |
| Total votes | 184,754 | 100.0% | ||
| Turnout | ||||
| Democratic hold | ||||
1988
| Party | Candidate | Votes | % | |
|---|---|---|---|---|
| Democratic | Anthony C. Beilenson (Incumbent) | 147,858 | 63.5% | |
| Republican | Jim Salomon | 77,184 | 33.1% | |
| Libertarian | John R. Vernon | 4,503 | 1.9% | |
| Peace and Freedom | John Honigsfeld | 3,316 | 1.4% | |
| No party | Write-ins | 18 | 0.0% | |
| Total votes | 232,879 | 100.0% | ||
| Turnout | ||||
| Democratic hold | ||||
1990
| Party | Candidate | Votes | % | |
|---|---|---|---|---|
| Democratic | Anthony C. Beilenson (Incumbent) | 103,141 | 61.7% | |
| Republican | Jim Salomon | 57,118 | 34.2% | |
| Peace and Freedom | John Honigsfeld | 6,834 | 4.1% | |
| Total votes | 167,093 | 100.0% | ||
| Turnout | ||||
| Democratic hold | ||||
1992
| Party | Candidate | Votes | % | |
|---|---|---|---|---|
| Republican | Elton Gallegly (Redistricted incumbent) | 115,504 | 54.3% | |
| Democratic | Anita Perez Ferguson | 88,225 | 41.4% | |
| Libertarian | Jay C. Wood | 9,091 | 4.3% | |
| No party | Dunbar (write-in) | 61 | 0.0% | |
| Total votes | 212,881 | 100.0% | ||
| Turnout | ||||
| Republican hold | ||||
1994
| Party | Candidate | Votes | % | |
|---|---|---|---|---|
| Republican | Elton Gallegly (Incumbent) | 114,043 | 66.17% | |
| Democratic | Kevin Ready | 47,345 | 27.47% | |
| Libertarian | Bill Brown | 6,481 | 3.76% | |
| Green | Robert T. Marston | 4,457 | 2.59% | |
| No party | Nagode (write-in) | 14 | 0.01% | |
| Total votes | 172,340 | 100.0% | ||
| Turnout | ||||
| Republican hold | ||||
1996
| Party | Candidate | Votes | % | |
|---|---|---|---|---|
| Republican | Elton Gallegly (Incumbent) | 118,880 | 59.6% | |
| Democratic | Robert Unruhe | 70,035 | 35.2% | |
| Libertarian | Gail Lightfoot | 8,346 | 4.1% | |
| Natural Law | Stephen Hospodar | 2,246 | 1.1% | |
| Total votes | 199,507 | 100.0% | ||
| Turnout | ||||
| Republican hold | ||||
1998
| Party | Candidate | Votes | % | |
|---|---|---|---|---|
| Republican | Elton Gallegly (Incumbent) | 96,362 | 60.06% | |
| Democratic | Daniel "Dan" Gonzalez | 64,068 | 39.94% | |
| Total votes | 160,430 | 100.0% | ||
| Turnout | ||||
| Republican hold | ||||
2000
| Party | Candidate | Votes | % | |
|---|---|---|---|---|
| Republican | Elton Gallegly (Incumbent) | 119,479 | 54.1% | |
| Democratic | Michael Case | 89,918 | 40.7% | |
| Reform | Cary Savitch | 6,473 | 3.0% | |
| Libertarian | Roger Peebles | 3,708 | 1.6% | |
| Natural Law | Stephen P. Hospodar | 1,456 | 0.6% | |
| Total votes | 221,034 | 100.0% | ||
| Turnout | ||||
| Republican hold | ||||
2002
| Party | Candidate | Votes | % | |
|---|---|---|---|---|
| Democratic | Lois Capps (Redistricted incumbent) | 95,752 | 59.1% | |
| Republican | Beth Rogers | 62,604 | 38.6% | |
| Libertarian | James E. Hill | 3,866 | 2.3% | |
| Total votes | 162,222 | 100.0% | ||
| Turnout | ||||
| Democratic hold | ||||
2004
| Party | Candidate | Votes | % | |
|---|---|---|---|---|
| Democratic | Lois Capps (Incumbent) | 153,980 | 63.1% | |
| Republican | Don Regan | 83,926 | 34.3% | |
| Libertarian | Michael Favorite | 6,391 | 2.6% | |
| Total votes | 244,297 | 100.0% | ||
| Turnout | ||||
| Democratic hold | ||||
2006
| Party | Candidate | Votes | % | |
|---|---|---|---|---|
| Democratic | Lois Capps (Incumbent) | 114,661 | 65.2% | |
| Republican | Victor G. Tognazzini | 61,272 | 34.8% | |
| No party | H.A. Gardner Jr. (write-in) | 18 | 0.0% | |
| Total votes | 175,951 | 100.0% | ||
| Turnout | ||||
| Democratic hold | ||||
2008
| Party | Candidate | Votes | % | |
|---|---|---|---|---|
| Democratic | Lois Capps (Incumbent) | 171,403 | 68.07% | |
| Republican | Matt Kokkonen | 80,385 | 31.93% | |
| Total votes | 251,788 | 100.00% | ||
| Turnout | 77.41% | |||
| Democratic hold | ||||
2010
| Party | Candidate | Votes | % | |
|---|---|---|---|---|
| Democratic | Lois Capps (Incumbent) | 111,768 | 57.8% | |
| Republican | Tom Watson | 72,744 | 37.6% | |
| Libertarian | Darrell M. Stafford | 3,326 | 1.7% | |
| No party | John V. Hager | 5,625 | 2.9% | |
| Total votes | 193,463 | 100.0% | ||
| Turnout | ||||
| Democratic hold | ||||
2012
| Party | Candidate | Votes | % | |
|---|---|---|---|---|
| Republican | Kevin McCarthy (Redistricted incumbent) | 158,161 | 73.2% | |
| No party preference | Terry Phillips | 57,842 | 26.8% | |
| Total votes | 216,003 | 100.0% | ||
| Republican hold | ||||
2014
| Primary election | ||||
|---|---|---|---|---|
| Party | Candidate | Votes | % | |
| Republican | Kevin McCarthy (Incumbent) | 58,334 | 99.1% | |
| Democratic | Raul Garcia (write-in) | 313 | 0.5% | |
| Republican | Mike Biglay (write-in) | 157 | 0.3% | |
| No party preference | Ronald L. Porter (write-in) | 36 | 0.1% | |
| Libertarian | Gail K. Lightfoot (write-in) | 31 | 0.1% | |
| Green | Noah Calugaru (write-in) | 3 | 0.01% | |
| Total votes | 58,871 | 100.0% | ||
| General election | ||||
| Republican | Kevin McCarthy (Incumbent) | 100,317 | 74.8% | |
| Democratic | Raul Garcia | 33,726 | 25.2% | |
| Total votes | 134,043 | 100.0% | ||
| Republican hold | ||||
2016
| Party | Candidate | Votes | % | |
|---|---|---|---|---|
| Republican | Kevin McCarthy (Incumbent) | 167,116 | 69.2% | |
| Democratic | Wendy Reed | 74,468 | 30.8% | |
| Total votes | 241,584 | 100.0% | ||
| Republican hold | ||||
2018
| Party | Candidate | Votes | % | |
|---|---|---|---|---|
| Republican | Kevin McCarthy (Incumbent) | 131,113 | 63.7% | |
| Democratic | Tatiana Matta | 74,661 | 36.3% | |
| Total votes | 205,774 | 100.0% | ||
| Republican hold | ||||
2020
| Primary election | ||||
|---|---|---|---|---|
| Party | Candidate | Votes | % | |
| Republican | Kevin McCarthy (Incumbent) | |||
| Democratic | Kim Mangone | |||
| Total votes | ||||
Historical district boundaries
References
- https://www.census.gov/mycd/?st=06&cd=23
- https://www.census.gov/mycd/?st=06&cd=23
- "Citizens Redistricting Commission Final Report, 2011" (PDF).
- "Partisan Voting Index – Districts of the 115th Congress" (PDF). The Cook Political Report. April 7, 2017. Retrieved April 7, 2017.
- "California's citizen commission final district maps: Find out what's changed where you live". Los Angeles Times. August 2, 2011.
- https://statewidedatabase.org/pub/data/MAPS/district/2001/cd23.pdf
- Patrick McGreevy (December 19, 2010). "New redistricting panel takes aim at bizarre political boundaries". Los Angeles Times. Retrieved 2010-12-19.
- Aaron Blake (July 27, 2011). "Name that district! (Gerrymandering edition)". Washington Post. Retrieved 2011-07-28.
- "Statement of Vote (2000 President)" (PDF). Archived from the original (PDF) on 2007-06-11. Retrieved 2008-09-17.
- "Statement of Vote (2000 Senator)" (PDF). Archived from the original (PDF) on 2007-06-11. Retrieved 2008-09-17.
- Statement of Vote (2002 Governor) Archived 2010-11-11 at the Wayback Machine
- "Statement of Vote (2003 Recall Question)" (PDF). Archived from the original (PDF) on 2011-05-20. Retrieved 2007-10-08.
- "Statement of Vote (2003 Governor)" (PDF). Archived from the original (PDF) on 2011-05-20. Retrieved 2007-10-08.
- "Statement of Vote (2004 President)" (PDF). Archived from the original (PDF) on 2010-08-01. Retrieved 2007-08-08.
- Statement of Vote (2004 Senator) Archived 2011-08-10 at the Wayback Machine
- Statement of Vote (2006 Governor) Archived 2011-08-10 at the Wayback Machine
- Statement of Vote (2006 Senator) Archived 2011-08-10 at the Wayback Machine
- "(2008 President)". Archived from the original on 2009-02-11. Retrieved 2009-03-05.
- 1942 election results
- 1944 election results
- 1946 election results
- 1948 election results
- 1950 election results
- 1952 election results
- 1954 election results
- 1956 election results
- 1958 election results
- 1960 election results
- 1962 election results
- 1963 special election results
- 1964 election results
- 1966 election results
- 1968 election results
- 1970 election results
- 1972 election results
- 1974 election results
- 1976 election results
- 1978 election results
- 1980 election results
- 1982 election results
- 1984 election results
- 1986 election results
- 1988 election results
- 1990 election results
- 1992 election results
- 1994 election results
- 1996 election results
- 1998 election results
- 2000 election results
- 2002 general election results Archived February 3, 2009, at the Wayback Machine
- 2004 general election results Archived 2008-08-21 at the Wayback Machine
- 2006 general election results Archived November 27, 2008, at the Wayback Machine
- "2010 general election results". Archived from the original on 2010-11-17. Retrieved 2010-12-09.
- 2012 general election results Archived October 19, 2013, at the Wayback Machine
- 2012 general election results Archived October 19, 2013, at the Wayback Machine
- 2018 general election results