California's 18th congressional district
California's 18th congressional district is a congressional district located in the U.S. state of California.
| California's 18th congressional district | |||
|---|---|---|---|
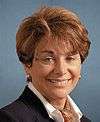
.tif.png) California's 18th congressional district since January 3, 2013 | |||
| Representative |
| ||
| Median income | $141,661[1] | ||
| Ethnicity | |||
| Cook PVI | D+23[3] | ||
The district is currently represented by Democrat Anna Eshoo. It includes portions of Santa Clara, San Mateo, and Santa Cruz counties, extending from the southwestern San Francisco Bay Area through the Santa Cruz Mountains to the Pacific coast. Cities and CDPs in the district include Palo Alto, Stanford, Los Altos, Mountain View, Los Altos Hills, Campbell, Saratoga, Los Gatos, and Scotts Valley; most of Menlo Park and Redwood City; and part of San Jose.
As of 2017, the district had a median household income of $125,000, higher than any other congressional district.[4]
From 2003 to 2013, the district was located in the San Joaquin Valley. It included Merced County and portions of San Joaquin, Stanislaus, Madera, and Fresno counties. Cities in the district included Modesto, most of Stockton, Ceres, Atwater, Merced and Los Banos.
Recent election results from statewide races
| Year | Office | Results |
|---|---|---|
| 2012 | President [5] | Obama 68.2 – 28.9% |
| Senator[6] | Feinstein 71.6 – 28.4% | |
| 2014 | Governor[7] | Brown 71.6 – 28.4% |
| 2016 | President[8] | Clinton 73.4 – 20.2% |
| Senator[9] | Harris 73.8 – 26.2% | |
| 2018 | Governor [10] | Newsom 72.5 – 27.5% |
| Senator[11] | Feinstein 60.9 – 39.1% |
Election results from statewide races before 2012
| Year | Office | Results |
|---|---|---|
| 1992 | President | Clinton 40.9 – 37.3% |
| Senator | Herschensohn 46.6 – 43.1% | |
| Senator | Feinstein 49.0 – 42.6% | |
| 1994 | Governor | [data unknown/missing] |
| Senator | [data unknown/missing] | |
| 1996 | President | [data unknown/missing] |
| 1998 | Governor | [data unknown/missing] |
| Senator | [data unknown/missing] | |
| 2000 | President[12] | Bush 52.6 – 43.9% |
| Senator[13] | Feinstein 49.0 – 43.6% | |
| 2002 | Governor[14] | Davis 50.5 – 40.2% |
| 2003 | Recall[15][16] | Yes 57.9 – 42.1% |
| Schwarzenegger 44.1 – 33.4% | ||
| 2004 | President[17] | Bush 49.6 – 49.3% |
| Senator[18] | Boxer 56.5 – 39.2% | |
| 2006 | Governor[19] | Schwarzenegger 55.7 – 39.7% |
| Senator[20] | Feinstein 58.6 – 36.2% | |
| 2008 | President[21] | Obama 59.2 – 38.3% |
| 2010 | Governor[22] | Brown 52.3 – 40.9% |
| Senator[23] | Boxer 47.9 – 44.5% |
List of representatives

.jpg)


Election results
|
1932 • 1934 • 1936 • 1938 • 1940 • 1942 • 1944 • 1946 • 1948 • 1950 • 1952 • 1954 • 1956 • 1958 • 1960 • 1962 • 1964 • 1966 • 1968 • 1970 • 1972 • 1974 • 1976 • 1978 • 1980 • 1982 • 1984 • 1986 • 1988 • 1990 • 1992 • 1994 • 1996 • 1998 • 2000 • 2002 • 2004 • 2006 • 2008 • 2010 • 2012 • 2014 • 2016 • 2018 |
1932
| Party | Candidate | Votes | % | ||
|---|---|---|---|---|---|
| Democratic | John H. Burke | 48,179 | 53.3 | ||
| Republican | Robert Henderson | 33,817 | 37.4 | ||
| Independent | William E. Hinshaw | 8,399 | 9.3 | ||
| Total votes | 90,395 | 100.0 | |||
| Turnout | |||||
| Democratic win (new seat) | |||||
1934
| Party | Candidate | Votes | % | |
|---|---|---|---|---|
| Democratic | Byron N. Scott | 52,377 | 56.3 | |
| Republican | William Brayton | 40,179 | 43.2 | |
| Communist | Clyde Champion | 507 | 0.5 | |
| Total votes | 93,063 | 100.0 | ||
| Turnout | ||||
| Democratic hold | ||||
1936
| Party | Candidate | Votes | % | |
|---|---|---|---|---|
| Democratic | Byron N. Scott (incumbent) | 61,415 | 59 | |
| Republican | James F. Collins | 42,748 | 41 | |
| Total votes | 134,163 | 100 | ||
| Turnout | ||||
| Democratic hold | ||||
1938
| Party | Candidate | Votes | % | |||
|---|---|---|---|---|---|---|
| Republican | Thomas M. Eaton | 52,216 | 48.6 | |||
| Democratic | Byron N. Scott (incumbent) | 51,874 | 48.3 | |||
| Progressive | Solomon Carr | 3,384 | 3.1 | |||
| Total votes | 107,474 | 100.0 | ||||
| Turnout | ||||||
| Republican gain from Democratic | ||||||
1940
| Party | Candidate | Votes | % | |
|---|---|---|---|---|
| Republican | William Ward Johnson (inc.) | 73,932 | 54.4 | |
| Democratic | Byron N. Scott | 60,764 | 44.7 | |
| Communist | George R. Ashby | 1,355 | 0.9 | |
| Total votes | 136,051 | 100.0 | ||
| Turnout | ||||
| Republican hold | ||||
1942
| Party | Candidate | Votes | % | |
|---|---|---|---|---|
| Republican | William Ward Johnson (inc.) | 53,136 | 56.8 | |
| Democratic | Francis H. Gentry | 40,339 | 43.2 | |
| Total votes | 93,475 | 100.0 | ||
| Turnout | ||||
| Republican hold | ||||
1944
| Party | Candidate | Votes | % | |||
|---|---|---|---|---|---|---|
| Democratic | Clyde Doyle | 95,090 | 55.7 | |||
| Republican | William Ward Johnson (inc.) | 75,749 | 44.3 | |||
| Total votes | 170,839 | 100.0 | ||||
| Turnout | ||||||
| Democratic gain from Republican | ||||||
1946
| Party | Candidate | Votes | % | |||
|---|---|---|---|---|---|---|
| Republican | Willis W. Bradley | 67,363 | 52.8 | |||
| Democratic | Clyde Doyle (incumbent) | 60,218 | 47.2 | |||
| Total votes | 127,581 | 100.0 | ||||
| Turnout | ||||||
| Republican gain from Democratic | ||||||
1948
| Party | Candidate | Votes | % | |||
|---|---|---|---|---|---|---|
| Democratic | Clyde Doyle | 105,687 | 51.1 | |||
| Republican | Willis W. Bradley (incumbent) | 92,721 | 44.9 | |||
| Progressive | Stanley Moffatt | 8,232 | 4.0 | |||
| Total votes | 206,640 | 100.0 | ||||
| Turnout | ||||||
| Democratic gain from Republican | ||||||
1950
| Party | Candidate | Votes | % | |
|---|---|---|---|---|
| Democratic | Clyde Doyle (incumbent) | 97,177 | 50.5 | |
| Republican | Craig Hosmer | 95,308 | 49.5 | |
| Total votes | 192,485 | 100.0 | ||
| Turnout | ||||
| Democratic hold | ||||
1952
| Party | Candidate | Votes | % | ||
|---|---|---|---|---|---|
| Republican | Craig Hosmer | 90,438 | 55.5 | ||
| Democratic | Joseph M. Kennick | 72,457 | 44.5 | ||
| Total votes | 162,895 | 100.0 | |||
| Turnout | |||||
| Republican win (new seat) | |||||
1954
| Party | Candidate | Votes | % | |
|---|---|---|---|---|
| Republican | Craig Hosmer (incumbent) | 71,731 | 55 | |
| Democratic | Joseph M. Kennick | 58,647 | 45 | |
| Total votes | 130,378 | 100 | ||
| Turnout | ||||
| Republican hold | ||||
1956
| Party | Candidate | Votes | % | |
|---|---|---|---|---|
| Republican | Craig Hosmer (incumbent) | 103,108 | 59.3 | |
| Democratic | Raymond C. "Ray" Simpson | 70,911 | 40.7 | |
| Total votes | 174,019 | 100.0 | ||
| Turnout | ||||
| Republican hold | ||||
1958
| Party | Candidate | Votes | % | |
|---|---|---|---|---|
| Republican | Craig Hosmer (incumbent) | 95,682 | 60 | |
| Democratic | Harry S. May | 63,684 | 40 | |
| Total votes | 159,366 | 100 | ||
| Turnout | ||||
| Republican hold | ||||
1960
| Party | Candidate | Votes | % | |
|---|---|---|---|---|
| Republican | Craig Hosmer (incumbent) | 129,851 | 70 | |
| Democratic | D. Patrick Ahern | 55,735 | 30 | |
| Total votes | 185,586 | 100 | ||
| Turnout | ||||
| Republican hold | ||||
1962
| Party | Candidate | Votes | % | |
|---|---|---|---|---|
| Democratic | Harlan Hagen (incumbent) | 91,684 | 58.9 | |
| Republican | G. Ray Arnett | 64,037 | 41.1 | |
| Total votes | 155,721 | 100.0 | ||
| Turnout | ||||
| Democratic hold | ||||
1964
| Party | Candidate | Votes | % | |
|---|---|---|---|---|
| Democratic | Harlan Hagen (incumbent) | 121,304 | 66.7 | |
| Republican | James E. Williams, Jr. | 60,523 | 33.3 | |
| Total votes | 181,827 | 100.0 | ||
| Turnout | ||||
| Democratic hold | ||||
1966
| Party | Candidate | Votes | % | |||
|---|---|---|---|---|---|---|
| Republican | Bob Mathias | 96,699 | 55.9 | |||
| Democratic | Harlan Hagen (incumbent) | 76,346 | 44.1 | |||
| Total votes | 173,045 | 100.0 | ||||
| Turnout | ||||||
| Republican gain from Democratic | ||||||
1968
| Party | Candidate | Votes | % | |
|---|---|---|---|---|
| Republican | Bob Mathias (incumbent) | 100,008 | 65.2 | |
| Democratic | Harlan Hagen | 51,274 | 33.4 | |
| American Independent | Edward Calvin Williams | 2,186 | 1.4 | |
| Total votes | 153,468 | 100.0 | ||
| Turnout | ||||
| Republican hold | ||||
1970
| Party | Candidate | Votes | % | |
|---|---|---|---|---|
| Republican | Bob Mathias (incumbent) | 86,071 | 63.2 | |
| Democratic | Milton Spartacus Miller | 48,415 | 33.4 | |
| American Independent | Nora E. Hensley | 1,709 | 3.4 | |
| Total votes | 136,195 | 100.0 | ||
| Turnout | ||||
| Republican hold | ||||
1972
| Party | Candidate | Votes | % | |
|---|---|---|---|---|
| Republican | Bob Mathias (incumbent) | 109,993 | 66.5 | |
| Democratic | Vincent J. Lavery | 55,484 | 33.5 | |
| Total votes | 165,477 | 100.0 | ||
| Turnout | ||||
| Republican hold | ||||
1974
| Party | Candidate | Votes | % | |
|---|---|---|---|---|
| Republican | William M. Ketchum (inc.) | 66,603 | 52.7 | |
| Democratic | George A. Seielstad | 59,931 | 47.3 | |
| Total votes | 126,534 | 100.0 | ||
| Turnout | ||||
| Republican hold | ||||
1976
| Party | Candidate | Votes | % | |
|---|---|---|---|---|
| Republican | William M. Ketchum (inc.) | 101,658 | 64.2 | |
| Democratic | Dean Close | 56,683 | 35.8 | |
| Total votes | 158,341 | 100.0 | ||
| Turnout | ||||
| Republican hold | ||||
1978
| Party | Candidate | Votes | % | |
|---|---|---|---|---|
| Republican | Bill Thomas | 85,663 | 59.3 | |
| Democratic | Bob Sogge | 58,900 | 40.7 | |
| Total votes | 144,563 | 100.0 | ||
| Turnout | ||||
| Republican hold | ||||
1980
| Party | Candidate | Votes | % | |
|---|---|---|---|---|
| Republican | Bill Thomas (incumbent) | 126,046 | 71 | |
| Democratic | Mary Pat Timmermans | 51,415 | 29 | |
| Total votes | 177,461 | 100 | ||
| Turnout | ||||
| Republican hold | ||||
1982
| Party | Candidate | Votes | % | ||
|---|---|---|---|---|---|
| Democratic | Richard H. Lehman | 92,762 | 59.5 | ||
| Republican | Adrian C. Fondse | 59,664 | 38.3 | ||
| Libertarian | Marshall William Fritz | 3,501 | 2.2 | ||
| Total votes | 155,927 | 100.0 | |||
| Turnout | |||||
| Democratic win (new seat) | |||||
1984
| Party | Candidate | Votes | % | |
|---|---|---|---|---|
| Democratic | Richard H. Lehman (inc.) | 128,186 | 67.3 | |
| Republican | Dale L. Ewen | 62,339 | 32.7 | |
| Total votes | 190,525 | 100.0 | ||
| Turnout | ||||
| Democratic hold | ||||
1986
| Party | Candidate | Votes | % | |
|---|---|---|---|---|
| Democratic | Richard H. Lehman (inc.) | 101,480 | 71.3 | |
| Republican | David C. Crevelt | 40,907 | 28.7 | |
| Total votes | 142,387 | 100.0 | ||
| Turnout | ||||
| Democratic hold | ||||
1988
| Party | Candidate | Votes | % | |
|---|---|---|---|---|
| Democratic | Richard H. Lehman (inc.) | 125,715 | 69.9 | |
| Republican | David A. Linn | 54,034 | 30.1 | |
| Total votes | 179,749 | 100.0 | ||
| Turnout | ||||
| Democratic hold | ||||
1990
| Party | Candidate | Votes | % | |
|---|---|---|---|---|
| Democratic | Richard H. Lehman (inc.) | 98,804 | 100.0 | |
| Turnout | ||||
| Democratic hold | ||||
1992
| Party | Candidate | Votes | % | |
|---|---|---|---|---|
| Democratic | Gary Condit (incumbent) | 139,704 | 84.7 | |
| Libertarian | Kim R. Almstrom | 25,307 | 15.3 | |
| Total votes | 165,011 | 100.0 | ||
| Turnout | ||||
| Democratic hold | ||||
1994
| Party | Candidate | Votes | % | |
|---|---|---|---|---|
| Democratic | Gary Condit (incumbent) | 91,106 | 65.52 | |
| Republican | Tom Carter | 44,046 | 31.68 | |
| Libertarian | James B. Morzella | 3,902 | 2.81 | |
| Total votes | 139,054 | 100.0 | ||
| Turnout | ||||
| Democratic hold | ||||
1996
| Party | Candidate | Votes | % | |
|---|---|---|---|---|
| Democratic | Gary Condit (incumbent) | 108,827 | 65.8% | |
| Republican | Bill Conrad | 52,695 | 31.8% | |
| Libertarian | James Morzella | 2,233 | 1.3% | |
| Natural Law | Page Riskin | 1,831 | 1.1% | |
| Total votes | 165,586 | 100.0% | ||
| Turnout | ||||
| Democratic hold | ||||
1998
| Party | Candidate | Votes | % | |
|---|---|---|---|---|
| Democratic | Gary Condit (incumbent) | 118,842 | 86.79% | |
| Libertarian | Linda M. Degroat | 18,089 | 13.21% | |
| Total votes | 136,931 | 100.0% | ||
| Turnout | ||||
| Democratic hold | ||||
2000
| Party | Candidate | Votes | % | |
|---|---|---|---|---|
| Democratic | Gary Condit (incumbent) | 118,842 | 67.2% | |
| Republican | Steve R. Wilson | 56,465 | 31.3% | |
| Natural Law | Page Roth Riskin | 2,860 | 1.5% | |
| Total votes | 178,167 | 100.0% | ||
| Turnout | ||||
| Democratic hold | ||||
2002
| Party | Candidate | Votes | % | |
|---|---|---|---|---|
| Democratic | Dennis Cardoza | 56,181 | 51.3 | |
| Republican | Dick Monteith | 47,528 | 43.4 | |
| American Independent | Kevin H. Cripe | 3,641 | 3.3 | |
| Libertarian | Linda De Groat | 2,194 | 2.0 | |
| No party | Donna Crowder (write-in) | 49 | 0.0 | |
| Turnout | 109,593 | |||
| Democratic hold | ||||
2004
| Party | Candidate | Votes | % | |
|---|---|---|---|---|
| Democratic | Dennis Cardoza (incumbent) | 103,732 | 67.5 | |
| Republican | Charles F. Pringle, Sr. | 49,973 | 32.5 | |
| Total votes | 153,705 | 100.0 | ||
| Turnout | ||||
| Democratic hold | ||||
2006
| Party | Candidate | Votes | % | |
|---|---|---|---|---|
| Democratic | Dennis Cardoza (incumbent) | 71,182 | 65.5 | |
| Republican | John A. Kanno | 37,531 | 34.5 | |
| Total votes | 108,713 | 100.0 | ||
| Turnout | ||||
| Democratic hold | ||||
2008
| Party | Candidate | Votes | % | |
|---|---|---|---|---|
| Democratic | Dennis Cardoza (incumbent) | 130,192 | 100.0 | |
| Total votes | 130,192 | 100.0 | ||
| Turnout | ||||
| Democratic hold | ||||
2010
| Party | Candidate | Votes | % | |
|---|---|---|---|---|
| Democratic | Dennis Cardoza (incumbent) | 72,853 | 58.48 | |
| Republican | Michael Clare Berryhill, Sr. | 51,716 | 41.52 | |
| Total votes | 124,569 | 100.00 | ||
| Turnout | ||||
| Democratic hold | ||||
2012
| Party | Candidate | Votes | % | |
|---|---|---|---|---|
| Democratic | Anna Eshoo | 212,831 | 70.5 | |
| Republican | Dave Chapman | 89,103 | 29.5 | |
| Total votes | 301,934 | 100.0 | ||
| Democratic hold | ||||
2014
| Party | Candidate | Votes | % | |
|---|---|---|---|---|
| Democratic | Anna Eshoo (incumbent) | 133,060 | 68% | |
| Republican | Richard B. Fox | 63,326 | 32% | |
| Total votes | 196,386 | 100% | ||
| Democratic hold | ||||
2016
| Party | Candidate | Votes | % | |
|---|---|---|---|---|
| Democratic | Anna Eshoo (incumbent) | 230,460 | 71% | |
| Republican | Richard B. Fox | 93,470 | 29% | |
| Total votes | 323,930 | 100% | ||
| Democratic hold | ||||
2018
| Party | Candidate | Votes | % | |
|---|---|---|---|---|
| Democratic | Anna Eshoo (incumbent) | 225,142 | 74.5% | |
| Republican | Christine Russell | 77,096 | 25.5% | |
| Total votes | 302,238 | 100% | ||
| Democratic hold | ||||
References
- https://www.census.gov/mycd/?st=06&cd=18
- "Citizens Redistricting Commission Final Report, 2011" (PDF).
- "Partisan Voting Index – Districts of the 115th Congress" (PDF). The Cook Political Report. April 7, 2017. Retrieved April 7, 2017.
- "Rich, poor, young, old: Congressional districts at a glance". Bloomberg Government. September 15, 2017. Retrieved August 10, 2018.
- "Statement of Vote (2000 President)" (PDF). Archived from the original (PDF) on 2011-05-20. Retrieved 2008-09-17.
- "Statement of Vote (2000 Senator)" (PDF). Archived from the original (PDF) on 2011-05-20. Retrieved 2008-09-17.
- Statement of Vote (2002 Governor) Archived November 11, 2010, at the Wayback Machine
- "Statement of Vote (2003 Recall Question)" (PDF). Archived from the original (PDF) on 2011-05-20. Retrieved 2007-10-08.
- "Statement of Vote (2003 Governor)" (PDF). Archived from the original (PDF) on 2011-05-20. Retrieved 2007-10-08.
- "Statement of Vote (2004 President)" (PDF). Archived from the original (PDF) on 2011-05-20. Retrieved 2007-08-08.
- Statement of Vote (2004 Senator) Archived August 10, 2011, at the Wayback Machine
- Statement of Vote (2006 Governor) Archived August 10, 2011, at the Wayback Machine
- Statement of Vote (2006 Senator) Archived August 10, 2011, at the Wayback Machine
- "(2008 President)". Archived from the original on 2009-02-11. Retrieved 2009-03-05.
- "Statement of Vote (2010 Governor)" (PDF). Archived from the original (PDF) on 2011-06-01. Retrieved 2011-07-27.
- "Statement of Vote (2010 Senator)" (PDF). Archived from the original (PDF) on 2011-06-01. Retrieved 2011-07-27.
- 1932 election results
- 1934 election results
- 1936 election results
- 1938 election results
- 1940 election results
- 1942 election results
- 1944 election results
- 1946 election results
- 1948 election results
- 1950 election results
- 1952 election results
- 1954 election results
- 1956 election results
- 1958 election results
- 1960 election results
- 1962 election results
- 1964 election results
- 1966 election results
- 1968 election results
- 1970 election results
- 1972 election results
- 1974 election results
- 1976 election results
- 1978 election results
- 1980 election results
- 1982 election results
- 1984 election results
- 1986 election results
- 1988 election results
- 1990 election results
- 1992 election results
- 1994 election results
- 1996 election results
- 1998 election results
- 2000 election results
- 2002 general election results Archived February 3, 2009, at the Wayback Machine
- 2004 general election results Archived August 21, 2008, at the Wayback Machine
- 2006 general election results Archived November 27, 2008, at the Wayback Machine
- 2008 general election results Archived December 21, 2008, at the Wayback Machine
- 2010 general election results
- 2012 general election results Archived October 19, 2013, at the Wayback Machine
- "U.S. House of Representatives District 18 - Districtwide Results". Archived from the original on 2014-12-21. Retrieved 2014-12-21.