Aleutians West Census Area, Alaska
Aleutians West Census Area (Russian: Западные Алеутские острова) is a census area located in the U.S. state of Alaska. As of the 2010 census, the population was 5,561.[2] It is part of the Unorganized Borough and therefore has no borough seat. Its largest city is Unalaska. It contains most of the Aleutian Islands, from Attu Island in the west to Unalaska Island in the east, as well as the Pribilof Islands, which lie north of the Aleutians in the Bering Sea.
Aleutians West Census Area | |
|---|---|
 | |
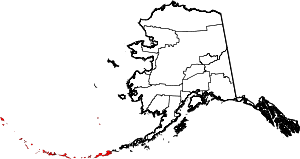 Location within the U.S. state of Alaska | |
.svg.png) Alaska's location within the U.S. | |
| Coordinates: 52°N 177°W | |
| Country | |
| State | |
| Established | 1980[1] |
| Largest city | Unalaska |
| Area | |
| • Total | 14,116 sq mi (36,560 km2) |
| • Land | 4,390 sq mi (11,400 km2) |
| • Water | 9,726 sq mi (25,190 km2) 68.9%% |
| Population | |
| • Estimate (2019) | 5,634 |
| • Density | 1.27/sq mi (0.49/km2) |
| Time zones | UTC−9 (Alaska) |
| • Summer (DST) | UTC−8 (ADT) |
| UTC−10 (Hawaii–Aleutian) | |
| • Summer (DST) | HADT |
| Congressional district | At-large |
Geography
According to the U.S. Census Bureau, the census area has a total area of 14,116 square miles (36,560 km2), of which 4,390 square miles (11,400 km2) is land and 9,726 square miles (25,190 km2) (68.9%) is water.[3] It borders the Aleutians East Borough to the east.
National protected areas
- Alaska Maritime National Wildlife Refuge (part of the Aleutian Islands and Bering Sea units)
- Aleutian World War II National Historic Area
Demographics
| Historical population | |||
|---|---|---|---|
| Census | Pop. | %± | |
| 1960 | 6,011 | — | |
| 1970 | 8,057 | 34.0% | |
| 1980 | 7,768 | −3.6% | |
| 1990 | 9,478 | 22.0% | |
| 2000 | 5,465 | −42.3% | |
| 2010 | 5,561 | 1.8% | |
| Est. 2019 | 5,634 | [4] | 1.3% |
| U.S. Decennial Census[5] 1790-1960[6] 1900-1990[7] 1990-2000[8] 2010-2018[2] | |||
At the 2000 census there were 5,465 people, 1,270 households, and 736 families residing in the census area. The population density was 1.24 people per square mile (0.48/km²). There were 2,234 housing units at an average density of 0.51/sq mi (0.20/km²). The racial makup of the census area was 40.04% White, 3.02% Black or African American, 20.95% Native American, 24.59% Asian, 0.62% Pacific Islander, 7.32% from other races, and 3.46% from two or more races. 10.48%.[9] were Hispanic or Latino of any race. 13.89% reported speaking Tagalog at home, while 11.22% speak Spanish, 5.97% Aleut, and 4.51% Vietnamese.[10]
Of the 1,270 households 35.40% had children under the age of 18 living with them, 44.00% were married couples living together, 7.60% had a female householder with no husband present, and 42.00% were non-families. 32.00% of households were one person and 2.10% were one person aged 65 or older. The average household size was 2.52 and the average family size was 3.26.
The age distribution was 17.20% under the age of 18, 7.80% from 18 to 24, 47.60% from 25 to 44, 25.10% from 45 to 64, and 2.30% 65 or older. The median age was 36 years. For every 100 females, there were 180.00 males. For every 100 females age 18 and over, there were 202.10 males.
A 2014 analysis by The Atlantic found the Aleutians West Census Area to be the most racially diverse county-equivalent in the United States.[11]
Communities
Cities
Census-designated places
Military base
See also
References
- In 1980, the United States Census Bureau divided the Unorganized Borough into 12 census areas.
- "State & County QuickFacts". United States Census Bureau. Archived from the original on August 9, 2014. Retrieved May 18, 2014.
- "US Gazetteer files: 2010, 2000, and 1990". United States Census Bureau. February 12, 2011. Retrieved April 23, 2011.
- "Population and Housing Unit Estimates". Retrieved May 11, 2019.
- "U.S. Decennial Census". United States Census Bureau. Retrieved May 18, 2014.
- "Historical Census Browser". University of Virginia Library. Retrieved May 18, 2014.
- "Population of Counties by Decennial Census: 1900 to 1990". United States Census Bureau. Retrieved May 18, 2014.
- "Census 2000 PHC-T-4. Ranking Tables for Counties: 1990 and 2000" (PDF). United States Census Bureau. Retrieved May 18, 2014.
- "U.S. Census website". United States Census Bureau. Retrieved May 14, 2011.
- "MLA Language Map Data Center". Archived from the original on September 30, 2007. Retrieved June 3, 2014.
- Narula, Svati Kirsten (April 29, 2014). "The 5 U.S. Counties Where Racial Diversity Is Highest—and Lowest". The Atlantic. Retrieved May 8, 2017.
External links
- Aleutians West Census Area at the Community Database Online from the Alaska Division of Community and Regional Affairs
- Maps from the Alaska Department of Labor and Workforce Development: 2010
Places adjacent to Aleutians West Census Area, Alaska | ||||||||||
|---|---|---|---|---|---|---|---|---|---|---|
| ||||||||||
Municipalities and communities of Aleutians West Census Area, Alaska, United States | ||
|---|---|---|
| Cities | Aleutians West Census Area map | |
| CDPs | ||
| Authority control |
|
|---|