2016 United States presidential election in New Hampshire
The 2016 United States presidential election in New Hampshire took place on November 8, 2016, as part of the 2016 United States presidential election. Voters chose the four electors to represent them in the Electoral College by a popular vote.
| ||||||||||||||||||||||||||
| Turnout | 75.03% | |||||||||||||||||||||||||
|---|---|---|---|---|---|---|---|---|---|---|---|---|---|---|---|---|---|---|---|---|---|---|---|---|---|---|
| ||||||||||||||||||||||||||
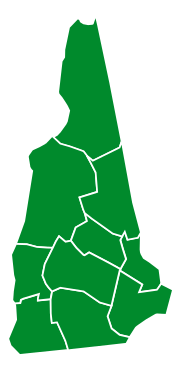
 County Results
| ||||||||||||||||||||||||||
| ||||||||||||||||||||||||||
.jpg)
| Elections in New Hampshire | ||||||||||
|---|---|---|---|---|---|---|---|---|---|---|
 | ||||||||||
|
||||||||||
|
||||||||||
|
|
||||||||||
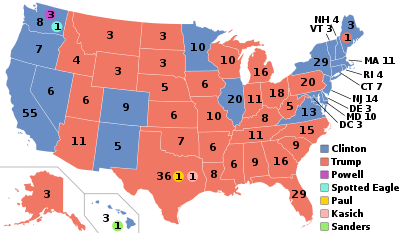
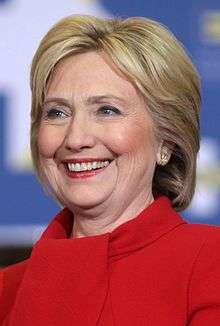
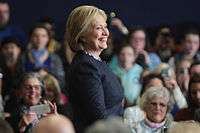
New Hampshire was won with a plurality by Hillary Clinton with a 0.4% margin, the second closest percentage behind Michigan.
On February 9, 2016, in the presidential primaries, voters expressed their preferences for the Democratic and Republican parties' respective nominees for president. Registered members of each party only voted in their party's primary, while voters who were unaffiliated chose any one primary in which to vote.
Primary elections
As per tradition and by New Hampshire electoral laws,[1] New Hampshire holds the primaries before any other state. As a result, candidates for nomination usually spend a long period campaigning in New Hampshire.
Democratic primary
| |||||||||||||||||||
| |||||||||||||||||||
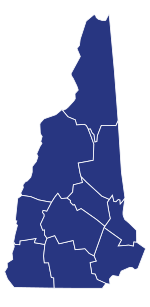
 New Hampshire results by county
Bernie Sanders | |||||||||||||||||||
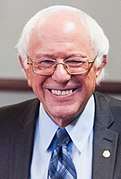
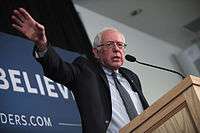
In the New Hampshire Democratic primary taking place on February 9, 2016, there were 24 pledged delegates and 8 super delegates that went to the Democratic National Convention. The pledged electors were allocated in this way. 16 delegates were allocated proportionally by congressional district (8 delegates per district). The other 8 delegates were allocated based on the statewide popular vote.[2]
Results
| New Hampshire Democratic primary, February 9, 2016 | |||||
|---|---|---|---|---|---|
| Candidate | Popular vote | Estimated delegates | |||
| Count | Of total | Pledged | Unpledged | Total | |
| Bernie Sanders | 152,193 | 60.14% | 15 | 1 | 16 |
| Hillary Clinton | 95,355 | 37.68% | 9 | 6 | 15 |
| Martin O'Malley (withdrawn) | 667 | 0.26% | |||
| Vermin Supreme | 268 | 0.11% | |||
| David John Thistle | 226 | 0.09% | |||
| Graham Schwass | 143 | 0.06% | |||
| Steve Burke | 108 | 0.04% | |||
| Rocky De La Fuente | 96 | 0.04% | |||
| John Wolfe Jr. | 54 | 0.02% | |||
| Jon Adams | 53 | 0.02% | |||
| Lloyd Thomas Kelso | 46 | 0.02% | |||
| Keith Russell Judd | 44 | 0.02% | |||
| Eric Elbot | 36 | 0.01% | |||
| Star Locke | 33 | 0.01% | |||
| William D. French | 29 | 0.01% | |||
| Mark Stewart Greenstein | 29 | 0.01% | |||
| Edward T. O'Donnell | 26 | 0.01% | |||
| James Valentine | 24 | 0.01% | |||
| Robert Lovitt | 22 | 0.01% | |||
| Michael Steinberg | 21 | 0.01% | |||
| William H. McGaughey Jr. | 19 | 0.01% | |||
| Henry Hewes | 18 | 0.01% | |||
| Edward Sonnino | 17 | 0.01% | |||
| Steven Roy Lipscomb | 15 | 0.01% | |||
| Sam Sloan | 15 | 0.01% | |||
| Brock C. Hutton | 14 | 0.01% | |||
| Raymond Michael Moroz | 8 | 0.00% | |||
| Richard Lyons Weil | 8 | 0.00% | |||
| Write-ins[lower-alpha 1] | 3,475 | 1.37% | |||
| Uncommitted | N/A | 0 | 1 | 1 | |
| Total | 253,062 | 100% | 24 | 8 | 32 |
| Sources: The Green Papers,[4] New Hampshire Secretary of State[5] | |||||
Republican primary
| |||||||||||||||||||||||||||||||||||||||||||||||||||||
| |||||||||||||||||||||||||||||||||||||||||||||||||||||
 New Hampshire results by county
Donald Trump | |||||||||||||||||||||||||||||||||||||||||||||||||||||
.jpg)
.jpg)
.jpg)
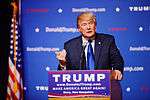
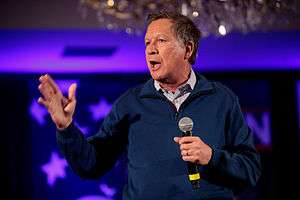
The New Hampshire Republican primary took place on February 9, 2016, where there were 23 bound delegates which were allocated proportionally and a candidate has to get at least 10% of the vote to get any delegates to the Republican National Convention.[6]
Results
| New Hampshire Republican primary, February 9, 2016 | |||||
|---|---|---|---|---|---|
| Candidate | Votes | Percentage | Actual delegate count | ||
| Bound | Unbound | Total | |||
| Donald Trump | 100,735 | 35.23% | 11 | 0 | 11 |
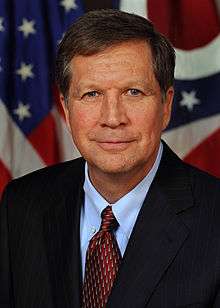
| John Kasich | 44,932 | 15.72% | 4 | 0 | 4 |
| Ted Cruz | 33,244 | 11.63% | 3 | 0 | 3 |
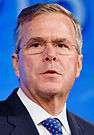
| Jeb Bush | 31,341 | 10.96% | 3 | 0 | 3 |
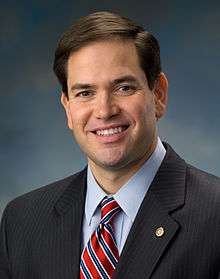
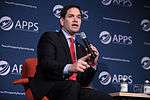
| Marco Rubio | 30,071 | 10.52% | 2 | 0 | 2 |
| Chris Christie | 21,089 | 7.38% | 0 | 0 | 0 |
| Carly Fiorina | 11,774 | 4.12% | 0 | 0 | 0 |
| Ben Carson | 6,527 | 2.28% | 0 | 0 | 0 |
| Rand Paul (withdrawn) | 1,930 | 0.68% | 0 | 0 | 0 |
| Write-ins | 2,912 | 1.02% | 0 | 0 | 0 |
| Mike Huckabee (withdrawn) | 216 | 0.08% | 0 | 0 | 0 |
| Andy Martin | 202 | 0.07% | 0 | 0 | 0 |
| Rick Santorum (withdrawn) | 160 | 0.06% | 0 | 0 | 0 |
| Jim Gilmore | 134 | 0.05% | 0 | 0 | 0 |
| Richard Witz | 104 | 0.04% | 0 | 0 | 0 |
| George Pataki (withdrawn) | 79 | 0.03% | 0 | 0 | 0 |
| Lindsey Graham (withdrawn) | 73 | 0.03% | 0 | 0 | 0 |
| Brooks Andrews Cullison | 56 | 0.02% | 0 | 0 | 0 |
| Timothy Cook | 55 | 0.02% | 0 | 0 | 0 |
| Bobby Jindal (withdrawn) | 53 | 0.02% | 0 | 0 | 0 |
| Frank Lynch | 47 | 0.02% | 0 | 0 | 0 |
| Joe Robinson | 44 | 0.02% | 0 | 0 | 0 |
| Stephen Bradley Comley | 32 | 0.01% | 0 | 0 | 0 |
| Chomi Prag | 16 | 0.01% | 0 | 0 | 0 |
| Jacob Daniel Dyas | 15 | 0.01% | 0 | 0 | 0 |
| Stephen John McCarthy | 12 | 0% | 0 | 0 | 0 |
| Walter Iwachiw | 9 | 0% | 0 | 0 | 0 |
| Kevin Glenn Huey | 8 | 0% | 0 | 0 | 0 |
| Matt Drozd | 6 | 0% | 0 | 0 | 0 |
| Robert Lawrence Mann | 5 | 0% | 0 | 0 | 0 |
| Peter Messina | 5 | 0% | 0 | 0 | 0 |
| Unprojected delegates: | 0 | 0 | 0 | ||
| Total: | 285,916 | 100.00% | 23 | 0 | 23 |
| Source: The Green Papers | |||||
General election
Polling
Results
| Party | Candidate | Votes | % | |
|---|---|---|---|---|
| Democratic | Hillary Clinton | 348,526 | 47.62% | |
| Republican | Donald Trump | 345,790 | 47.25% | |
| Libertarian | Gary Johnson | 30,694 | 4.13% | |
| Green | Jill Stein | 6,465 | 0.87% | |
| Independent | Evan McMullin (write-in) | 1,064 | 0.15% | |
| Reform | Rocky De La Fuente | 677 | 0.1% | |
| n/a | Total Other Write-in | 10,965 | 1.47% | |
| Total votes | 743,117 | 100.00% | ||
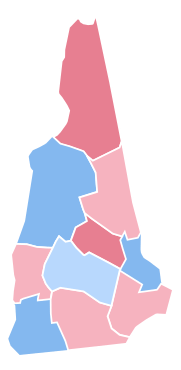
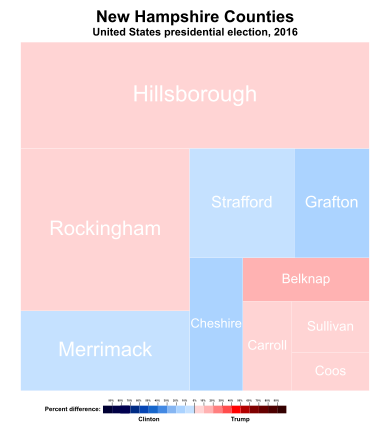
By county
| County | Clinton% | Clinton# | Trump% | Trump# | Others% | Others# | Total |
|---|---|---|---|---|---|---|---|
| Belknap | 39.11% | 13,517 | 55.89% | 19,315 | 4.99% | 2,122 | 34,558 |
| Carroll | 44.63% | 12,987 | 50.29% | 14,635 | 5.09% | 1,901 | 29,102 |
| Cheshire | 53.66% | 22,064 | 41.04% | 16,876 | 5.30% | 2,818 | 41,121 |
| Coos | 42.94% | 6,563 | 52.03% | 7,952 | 5.03% | 1046 | 15,284 |
| Grafton | 56.89% | 28,510 | 37.93% | 19,010 | 5.18% | 3,454 | 50,115 |
| Hillsborough | 47.26% | 99,589 | 47.46% | 100,013 | 5.29% | 13,835 | 210,746 |
| Merrimack | 48.98% | 40,198 | 45.91% | 37,674 | 5.11% | 5,515 | 82,064 |
| Rockingham | 44.65% | 79,994 | 50.48% | 90,447 | 4.87% | 10,373 | 179,168 |
| Strafford | 51.33% | 34,894 | 42.77% | 29,072 | 5.90% | 4,873 | 67,980 |
| Sullivan | 46.14% | 10,210 | 48.79% | 10,796 | 5.07% | 1,632 | 22,129 |
Analysis
Hillary Clinton's margin of victory was the smallest for a Democrat in the state since Woodrow Wilson narrowly won it in 1916. New Hampshire last voted for a Republican, George W. Bush, in 2000, and although Trump did not win New Hampshire, the top-line county results were exactly the same in 2000 and 2016. Despite Trump's narrow loss, this would be the first presidential election since 2000 where New Hampshire would vote more Republican than the national average, along with the first time since 1976 when the winner of Coos County did not also carry the state as well.
Allegations of voting irregularities
On September 7, 2017, state House speaker Shawn Jasper announced that data showed that 6,540 people voted using out-of-state licenses. Of those, only 15% had received state licenses by August 2017. Of the remaining 5,526, only 3.3% had registered a motor vehicle in New Hampshire. In addition to the close vote for president, Democratic Governor Maggie Hassan defeated incumbent Republican Senator Kelly Ayotte by 1,017 votes. In February 2017, President Trump had told a gathering of senators at the White House that fraudulent out-of-state voting had cost him and Ayotte the election in New Hampshire. Mainstream media disputed Trump's and Japser's assertion.[8] New Hampshire law permits New Hampshire residents to vote using out-of-state identification if they are domiciled in the state, out-of-state college students attending schools in New Hampshire being one example of such legitimate use of out-of-state identification.[9]
Several investigations by New Hampshire's Ballot Law Commission found no evidence of widespread fraud, and only 4 instances of fraud total in the state for the 2016 elections.[10] Specifically addressing the claim of people being bussed in from out of state to vote, Associate Attorney General Anne Edwards noted that they found no evidence for such claims. When they investigated these claims, they found that the buses were chartered out of state, but the voters on the buses lived in New Hampshire and could legally vote there.[11]
See also
Notes
- The write-ins include 3,248 votes for these 11 Republican presidential candidates: Trump (1795), Kasich (438), Jeb Bush (263), Christie (216), Marco Rubio (203), Ted Cruz (162), Fiorina (99), Carson (52), Paul (12), Gilmore (6), Huckabee (2).[3]
References
- Gregg, Hugh (1997). "First-In-The-Nation Presidential Primary". New Hampshire Almanac. State of New Hampshire. Retrieved 4 August 2016.
- "New Hampshire Democratic Delegation 2016". www.thegreenpapers.com. Retrieved 2017-02-23.
- "2016 Presidential Primary - Democratic President: Summary Democratic Write-ins". New Hampshire Secretary of State. Archived from the original on February 14, 2020. Retrieved February 14, 2020.
- "2016 Presidential Primaries, Caucuses, and Conventions: New Hampshire Democrat Presidential Nominating Process". The Green Papers. December 5, 2019. Archived from the original on February 18, 2018. Retrieved February 10, 2016.
- "2016 Presidential Primary - Democratic President: Summary Democratic 16PP". New Hampshire Secretary of State. February 2016. Archived from the original on February 14, 2020. Retrieved February 14, 2020.
- "New Hampshire Republican Delegation 2016". www.thegreenpapers.com. Retrieved 2017-02-23.
- "2016 Presidential General Election Results In New Hampshire".
- Weigel, David, "Election Integrity Commission members accuse New Hampshire voters of fraud", The Washington Post, 8 September 2017' Scarborough, Rowan, "More than 5,000 out-of-state voters may have tipped New Hampshire against Trump", Washington Times, September 7, 2017
- UNH Votes, ""
- "After Exhaustive Investigations, NH Officials Find No Widespread Fraud in Recent Elections". New Hampshire Public Radio. May 29, 2018. Retrieved December 3, 2018.
- "After Exhaustive Investigations, NH Officials Find No Widespread Fraud in Recent Elections". New Hampshire Public Radio. May 29, 2018. Retrieved December 3, 2018.