1997 Polish parliamentary election
Parliamentary elections were held in Poland on 21 September 1997.[1] In the Sejm elections, 47.93% of citizens cast their votes, 96.12% of which were counted as valid. In the Senate elections, 46.92% of citizens cast their votes, 97.82% of which were valid.
| |||||||||||||||||||||||||||||||||||||||||||||||||||||||||||||||||||||||||||||||||||||||||||||
All 460 seats in the Sejm 231 seats were needed for a majority in the Sejm All 100 seats in the Senate | |||||||||||||||||||||||||||||||||||||||||||||||||||||||||||||||||||||||||||||||||||||||||||||
|---|---|---|---|---|---|---|---|---|---|---|---|---|---|---|---|---|---|---|---|---|---|---|---|---|---|---|---|---|---|---|---|---|---|---|---|---|---|---|---|---|---|---|---|---|---|---|---|---|---|---|---|---|---|---|---|---|---|---|---|---|---|---|---|---|---|---|---|---|---|---|---|---|---|---|---|---|---|---|---|---|---|---|---|---|---|---|---|---|---|---|---|---|---|
| Turnout | 47.9% | ||||||||||||||||||||||||||||||||||||||||||||||||||||||||||||||||||||||||||||||||||||||||||||
| |||||||||||||||||||||||||||||||||||||||||||||||||||||||||||||||||||||||||||||||||||||||||||||
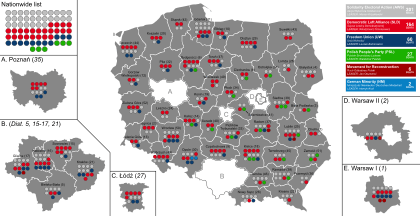 Seats won by Sejm District | |||||||||||||||||||||||||||||||||||||||||||||||||||||||||||||||||||||||||||||||||||||||||||||
| |||||||||||||||||||||||||||||||||||||||||||||||||||||||||||||||||||||||||||||||||||||||||||||
.jpg)


_mit_Henryk_Kroll_(cropped).jpg)
The elections were won by the liberal conservative party Solidarity Electoral Action only to lead to a coalition forming with the Freedom Union, another liberal party. The elections were a major setback for the Democratic Left Alliance and the Polish People's Party, which were forced out of government.
Opinion polls
Results
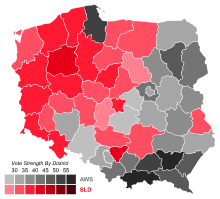
Results of the Sejm election, showing vote strength by electoral district.
| Party | 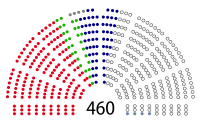 |
 | ||||||
|---|---|---|---|---|---|---|---|---|
| Sejm | Senate | |||||||
| Votes | % | Seats | +/– | Votes | % | Seats | +/– | |
| Solidarity Electoral Action | 4,427,373 | 33.8 | 201 | New | 6,550,176 | 49.2 | 51 | New |
| Democratic Left Alliance | 3,551,224 | 27.1 | 164 | –7 | 6,091,721 | 45.7 | 28 | –9 |
| Freedom Union | 1,749,518 | 13.4 | 60 | –14 | 2,943,527 | 22.1 | 8 | +4 |
| Polish People's Party | 956,184 | 7.3 | 27 | –105 | 1,819,176 | 13.7 | 3 | –33 |
| Movement for Reconstruction of Poland | 727,072 | 5.6 | 6 | New | 2,553,252 | 19.2 | 5 | New |
| Labour Union | 620,611 | 4.7 | 0 | –41 | 520,130 | 3.9 | 0 | 0 |
| National Party of Retirees and Pensioners | 284,826 | 2.2 | 0 | New | 1,112,129 | 8.4 | 0 | New |
| Real Politics Union | 266,317 | 2.0 | 0 | 0 | 550,254 | 4.1 | 0 | 0 |
| National Party of Retirees and Pensioners–Polish Republic | 212,826 | 1.6 | 0 | New | – | – | – | – |
| National Christian Bloc for Poland | 178,395 | 1.4 | 0 | New | – | – | – | – |
| German Minority TS-KNSO | 51,027 | 0.4 | 2 | –2 | – | – | – | – |
| TSKNWk[a] | 16,724 | 0.1 | 0 | – | – | – | – | – |
| Słowiańska MN RP-Prawosławni | 13,632 | 0.1 | 0 | – | – | – | – | – |
| Self-Defence of the Republic of Poland | 10,073 | 0.1 | 0 | 0 | – | – | – | – |
| Polska Wspólnota Narodowa PSN | 8,590 | 0.1 | 0 | – | – | – | – | – |
| TSKNWC[b] | 6,206 | 0.0 | 0 | – | – | – | – | – |
| MN "Pojednanie i Przyszlość" | 3,663 | 0.0 | 0 | – | – | – | – | – |
| MN Województwa Olsztyńskiego | 1,729 | 0.0 | 0 | – | – | – | – | – |
| Niezależna i bezpartyjna | 924 | 0.0 | 0 | – | – | – | – | – |
| Sojusz Ludzi "Polska, Praca, Sprawiedliwość" | 703 | 0.0 | 0 | – | – | – | – | – |
| Stow. MN Województwa Elbląskiego | 614 | 0.0 | 0 | – | – | – | – | – |
| Local lists | – | – | – | – | 3,804,084 | 28.6 | 5 | –5 |
| Invalid/blank votes | 528,147 | – | – | – | 269,149 | – | – | – |
| Total | 13,616,378 | 100 | 460 | 0 | 13,614,101 | 100 | 100 | 0 |
| Registered voters/turnout | 28,409,054 | 47.9 | – | – | 28,409,054 | 47.9 | – | – |
| Source: Nohlen & Stöver | ||||||||
a Towarzystwo Społeczno-Kulturalne Niemców Województwa Katowickiego
b Towarzystwo Społeczno-Kulturalne Niemców Województwa Częstochowskiego
By constituency
| Constituency | Turnout | AWS | SLD | UW | PSL | ROP | UP | MN | Others | Lead |
|---|---|---|---|---|---|---|---|---|---|---|
| 1 – Warsaw I | 60.86 | 31.88 | 25.90 | 21.73 | 0.94 | 9.16 | 4.98 | - | 5.41 | 5.98 |
| 2 – Warsaw II | 49.14 | 40.15 | 19.00 | 15.30 | 5.76 | 8.30 | 4.48 | - | 7.01 | 21.15 |
| 3 – Biała Podlaska | 46.72 | 35.39 | 19.84 | 5.86 | 18.17 | 6.88 | 4.08 | - | 9.78 | 15.55 |
| 4 – Białystok | 52.12 | 44.29 | 24.89 | 7.16 | 3.48 | 5.64 | 4.42 | - | 10.12 | 19.40 |
| 5 – Bielsko-Biała | 56.15 | 43.01 | 21.06 | 15.59 | 4.83 | 4.80 | 3.82 | - | 6.89 | 21.95 |
| 6 – Bydgoszcz | 48.16 | 27.62 | 36.99 | 11.50 | 6.42 | 4.46 | 4.36 | - | 8.65 | 9.37 |
| 7 – Chełm | 39.26 | 23.89 | 28.66 | 7.91 | 12.83 | 8.96 | 4.58 | - | 13.17 | 4.77 |
| 8 – Ciechanów | 38.40 | 28.73 | 29.69 | 6.86 | 14.49 | 6.55 | 5.67 | - | 8.01 | 0.96 |
| 9 – Częstochowa | 45.01 | 30.60 | 31.36 | 9.84 | 6.48 | 4.82 | 5.37 | - | 11.53 | 0.76 |
| 10 – Elbląg | 40.97 | 26.26 | 33.92 | 12.70 | 6.42 | 5.97 | 6.15 | - | 8.58 | 7.66 |
| 11 – Gdańsk | 55.01 | 50.10 | 20.20 | 13.45 | 2.08 | 4.85 | 3.00 | - | 6.32 | 29.90 |
| 12 – Gorzów Wielkopolski | 42.88 | 25.68 | 35.23 | 14.14 | 8.65 | 3.07 | 6.89 | - | 6.34 | 9.55 |
| 13 – Jelenia Góra | 44.86 | 27.58 | 35.70 | 12.39 | 3.47 | 3.87 | 9.31 | - | 7.68 | 8.12 |
| 14 – Kalisz | 48.76 | 26.12 | 32.56 | 11.62 | 12.26 | 4.48 | 6.44 | - | 6.52 | 6.44 |
| 15 – Sosnowiec | 48.80 | 22.51 | 44.67 | 12.23 | 2.96 | 3.62 | 6.58 | - | 7.43 | 22.16 |
| 16 – Katowice | 44.53 | 31.99 | 26.92 | 22.52 | 3.11 | 3.26 | 4.39 | - | 7.81 | 5.07 |
| 17 – Gliwice | 45.63 | 34.77 | 23.10 | 17.30 | 2.65 | 5.04 | 4.41 | - | 11.73 | 10.67 |
| 18 – Kielce | 41.79 | 24.61 | 31.81 | 10.41 | 14.72 | 5.31 | 5.95 | - | 7.19 | 7.20 |
| 19 – Konin | 48.76 | 27.66 | 30.56 | 9.63 | 12.51 | 5.03 | 6.14 | - | 8.47 | 2.90 |
| 20 – Koszalin | 41.70 | 22.22 | 36.11 | 14.22 | 4.35 | 4.33 | 4.92 | - | 13.85 | 13.89 |
| 21 – Kraków | 53.48 | 40.76 | 17.64 | 20.60 | 4.23 | 4.84 | 3.13 | - | 8.80 | 20.16 |
| 22 – Krosno | 52.79 | 47.20 | 15.58 | 7.60 | 7.03 | 10.02 | 3.69 | - | 8.88 | 31.62 |
| 23 – Legnica | 44.35 | 32.49 | 34.88 | 10.75 | 4.80 | 3.93 | 5.47 | - | 7.68 | 2.39 |
| 24 – Leszno | 47.98 | 25.77 | 33.89 | 12.67 | 11.47 | 2.84 | 5.19 | - | 8.17 | 8.12 |
| 25 – Lublin | 47.06 | 35.41 | 23.19 | 9.14 | 11.64 | 8.82 | 5,31 | - | 6.49 | 12.22 |
| 26 – Łomża | 46.41 | 47.13 | 13.96 | 5.47 | 11.43 | 11.02 | 4.26 | - | 6.73 | 33.17 |
| 27 – Łódź | 50.11 | 28.84 | 37.07 | 14.83 | 1.80 | 6.44 | 4.28 | - | 6.74 | 8.23 |
| 28 – Nowy Sącz | 56.57 | 56.03 | 10.51 | 9.91 | 7.17 | 3.48 | 2.23 | - | 10.67 | 45.52 |
| 29 – Olsztyn | 42.49 | 25.86 | 33.40 | 15.16 | 5.68 | 5.61 | 5.74 | - | 8.55 | 7.54 |
| 30 – Opole | 42.19 | 25.50 | 22.26 | 13.83 | 4.92 | 4.80 | 4.97 | 16.96 | 6.76 | 3.24 |
| 31 – Ostrołęka | 42.23 | 35.45 | 18.04 | 8.23 | 15.97 | 9.23 | 4.05 | - | 9.03 | 17.41 |
| 32 – Piła | 49.81 | 22.80 | 40.08 | 12.59 | 7.43 | 4.59 | 3.72 | - | 8.79 | 17.28 |
| 33 – Piotrków Trybunalski | 42.59 | 28.99 | 26.84 | 9.21 | 14.11 | 7.73 | 4.57 | - | 8.55 | 2.15 |
| 34 – Płock | 41.29 | 23.15 | 30.79 | 8.38 | 21.26 | 4.82 | 3.73 | - | 7.87 | 7.64 |
| 35 – Poznań | 53.26 | 26.95 | 31.35 | 18.31 | 4.71 | 3.23 | 6.80 | - | 8.65 | 4.4 |
| 36 – Przemyśl | 52.15 | 43.78 | 15.44 | 7.85 | 13.64 | 5.13 | 2.70 | - | 11.46 | 28.34 |
| 37 – Radom | 43.56 | 32.50 | 22.05 | 10.09 | 14.35 | 8.41 | 4.18 | - | 8.42 | 10.45 |
| 38 – Rzeszów | 59.81 | 57.81 | 13.58 | 6.10 | 9.14 | 5.48 | 2.56 | - | 5.33 | 44.23 |
| 39 – Siedlce | 40.40 | 34.73 | 20.80 | 6.02 | 20.59 | 6.69 | 3.65 | - | 7.52 | 13.93 |
| 40 – Sieradz | 42.35 | 24.96 | 29.36 | 8.81 | 16.74 | 5.79 | 6.84 | - | 7.50 | 4.4 |
| 41 – Skierniewice | 41.78 | 25.49 | 24.51 | 9.65 | 19.58 | 6.60 | 3.80 | - | 10.37 | 0.98 |
| 42 – Słupsk | 42.46 | 25.97 | 35.05 | 12.83 | 7.22 | 3.94 | 5.69 | - | 9.30 | 9.08 |
| 43 – Suwałki | 40.80 | 33.34 | 27.04 | 10.57 | 8.99 | 5.38 | 6.05 | - | 8.63 | 6.30 |
| 44 – Szczecin | 45.16 | 28.24 | 34.87 | 17.28 | 3.09 | 3.55 | 5.07 | - | 7.90 | 6.63 |
| 45 – Tarnobrzeg | 46.44 | 39.29 | 23.73 | 7.11 | 11.60 | 8.00 | 2.80 | - | 7.47 | 15.56 |
| 46 – Tarnów | 53.68 | 51.48 | 12.20 | 9.19 | 11.91 | 4.88 | 3.47 | - | 6.87 | 39.28 |
| 47 – Toruń | 43.91 | 28.41 | 32.71 | 14.09 | 7.16 | 4.49 | 5.28 | - | 7.86 | 4.3 |
| 48 – Wałbrzych | 45.31 | 27.69 | 38.36 | 11.65 | 3.86 | 3.98 | 6.68 | - | 7.78 | 10.67 |
| 49 – Włocławek | 40.41 | 25.16 | 38.35 | 7.42 | 10.83 | 5.87 | 6.19 | - | 6.18 | 13.19 |
| 50 – Wrocław | 60.86 | 33.02 | 25.96 | 20.65 | 4.04 | 5.08 | 4.57 | - | 6.68 | 7.06 |
| 51 – Zamość | 46.05 | 33.43 | 18.95 | 5.26 | 24.58 | 8.45 | 3.35 | - | 5.98 | 8.85 |
| 52 – Zielona Góra | 44.90 | 28.59 | 37.37 | 11.70 | 6.87 | 3.20 | 5.73 | - | 6.54 | 8.78 |
| Poland | 47.93 | 33.83 | 27.13 | 13.37 | 7.31 | 5.56 | 4.74 | 0.39 | 7.67 | 6.70 |
References
- Dieter Nohlen & Philip Stöver (2010) Elections in Europe: A data handbook, p1491 ISBN 978-3-8329-5609-7
- Obwieszczenie Państwowej Komisji Wyborczej z dn. 25 IX 1997 r., Monitor Polski. Nr 64, poz. 620
- Obwieszczenie PKW z dn. 25 IX 1997 r., M.P. Nr 64, poz. 621
| Presidential elections | |
|---|---|
| Legislative elections | |
| Local elections | |
| European elections | |
| Referendums | |
| |
| 1990–1995 Wałęsa Presidency |
|  |
|---|---|---|
| 1995–2005 Kwaśniewski Presidency |
| |
| 2005–2010 Kaczyński Presidency |
| |
| 2010–2015 Komorowski Presidency |
| |
| 2015-present Duda Presidency |
| |
This article is issued from Wikipedia. The text is licensed under Creative Commons - Attribution - Sharealike. Additional terms may apply for the media files.