1976 Portuguese legislative election
The Portuguese legislative election of 1976 took place on 25 April, exactly one year after the previous election, and two years after the Carnation Revolution. With a new Constitution approved, the country's main aim was economic recovery and strengthening its democratic institutions.
| ||||||||||||||||||||||||||||||||||||||||||||||||||||||||||||||||||||||||||||||||||
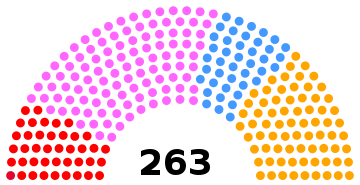
263 seats to the Portuguese Assembly 132 seats needed for a majority | ||||||||||||||||||||||||||||||||||||||||||||||||||||||||||||||||||||||||||||||||||
|---|---|---|---|---|---|---|---|---|---|---|---|---|---|---|---|---|---|---|---|---|---|---|---|---|---|---|---|---|---|---|---|---|---|---|---|---|---|---|---|---|---|---|---|---|---|---|---|---|---|---|---|---|---|---|---|---|---|---|---|---|---|---|---|---|---|---|---|---|---|---|---|---|---|---|---|---|---|---|---|---|---|---|
| Registered | 6,564,667 | |||||||||||||||||||||||||||||||||||||||||||||||||||||||||||||||||||||||||||||||||
| Turnout | 5,483,461 (83.5%) | |||||||||||||||||||||||||||||||||||||||||||||||||||||||||||||||||||||||||||||||||
| ||||||||||||||||||||||||||||||||||||||||||||||||||||||||||||||||||||||||||||||||||
 Results by district or autonomous region. | ||||||||||||||||||||||||||||||||||||||||||||||||||||||||||||||||||||||||||||||||||
| ||||||||||||||||||||||||||||||||||||||||||||||||||||||||||||||||||||||||||||||||||
.jpg)
.jpg)

.jpg)

| This article is part of the series: |
| Politics and government of Portugal |
|---|
 |
| Portugal |
The Socialist Party won a plurality of legislative seats, and its leader Mário Soares became the Prime Minister of the 1st Constitutional government on 23 July 1976. The lack of a socialist majority forced his party to form an unexpected coalition with the Democratic and Social Center, a right-wing party. The nature of this coalition, between a socialist party and a conservative party that voted against the new constitution because of its socialist influences, surprised most Portuguese voters and marked the start of the Socialist Party's right-wing turn that would soon be attacked by all the left due to the new government's measures against left-wing reforms following the Carnation Revolution, mainly concerning agrarian reform, in what was called the PS' putting "Socialism in the drawer".[3]
The Social Democratic Party (then known as the Democratic People's Party, PPD) won the second most seats and the Portuguese Communist Party achieved considerable gains that reflected its growing influence, mainly in the south of the country.
Electoral system
The Assembly of the Republic has 263 members elected to four-year terms. The total number of MPs increased to 263 from the 1975 total of 250 MPs. Governments do not require absolute majority support of the Assembly to hold office, as even if the number of opposers of government is larger than that of the supporters, the number of opposers still needs to be equal or greater than 132 (absolute majority) for both the Government's Programme to be rejected or for a motion of no confidence to be approved.[4]
The number of seats assigned to each district depends on the district magnitude.[5] The use of the d'Hondt method makes for a higher effective threshold than certain other allocation methods such as the Hare quota or Sainte-Laguë method, which are more generous to small parties.[6]
Parties
The major parties involved and the respective leaders:
- Portuguese Communist Party (PCP), Álvaro Cunhal
- Socialist Party (PS), Mário Soares
- Democratic People's Party (PPD), Francisco Sá Carneiro
- Democratic and Social Centre (CDS), Freitas do Amaral
Campaign period
Party slogans
| Party or alliance | Original slogan | English translation | Refs | |
|---|---|---|---|---|
| PS | « Queremos e podemos reconstruir o país » | "We want and we can rebuild the country" | [7] | |
| PPD | « Portugal com Sá Carneiro » | "Portugal with Sá Carneiro" | [8] | |
| PCP | « Para uma maioria de esquerda » | "For a left-wing majority" | [9] | |
| CDS | « A resposta é muito simples » | "The answer is very simple" | [10] | |
National summary of votes and seats
 | ||||||||||
| Parties | Votes | % | ± | Seats | MPs %/ votes % | |||||
|---|---|---|---|---|---|---|---|---|---|---|
| 1975 | 1976 | ± | % | ± | ||||||
| Socialist | 1,912,921 | 34.89 | 116 | 107 | 40.68 | 1.17 | ||||
| Democratic People's | 1,335,381 | 24.35 | 81 | 73 | 27.76 | 1.14 | ||||
| Democratic and Social Centre | 876,007 | 15.98 | 16 | 42 | 15.97 | 1.00 | ||||
| Communist | 788,830 | 14.39 | 30 | 40 | 15.21 | 1.06 | ||||
| People's Democratic Union | 91,690 | 1.67 | 1 | 1 | 0.38 | 0.23 | ||||
| People's Socialist Front | 42,162 | 0.77 | 0 | 0 | 0.00 | 0.0 | ||||
| Portuguese Workers' Communist | 36,200 | 0.66 | N/A | N/A | 0 | N/A | 0.00 | N/A | 0.0 | |
| Movement of Socialist Left | 31,332 | 0.57 | 0 | 0 | 0.00 | 0.0 | ||||
| Christian Democratic | 29,874 | 0.54 | N/A | N/A | 0 | N/A | 0.00 | N/A | 0.0 | |
| People's Monarchist | 28,320 | 0.52 | 0 | 0 | 0.00 | 0.0 | ||||
| Internationalist Communist League | 16,269 | 0.30 | 0 | 0 | 0.00 | 0.0 | ||||
| PCP(m-l) | 15,830 | 0.29 | N/A | N/A | 0 | N/A | 0.00 | N/A | 0.0 | |
| Worker-Peasant Alliance | 15,778 | 0.29 | N/A | N/A | 0 | N/A | 0.00 | N/A | 0.0 | |
| Revolutionary Socialist | 5,171 | 0.09 | N/A | N/A | 0 | N/A | 0.00 | N/A | 0.0 | |
| Total valid | 5,225,765 | 95.30 | 250[A] | 263 | 100.00 | — | ||||
| Invalid ballots | 257,696 | 4.70 | ||||||||
| Total (turnout 83.53%) | 5,483,461 | 100.00 | ||||||||
| A Portuguese Democratic Movement won 5 seats and the Independent Democratic Association of Macau won 1 seat in the 1975 election. Both parties did not contested this election. | ||||||||||
| Source: Comissão Nacional de Eleições | ||||||||||
Distribution by constituency
| Constituency | % | S | % | S | % | S | % | S | % | S | Total S |
|---|---|---|---|---|---|---|---|---|---|---|---|
| PS | PPD | CDS | PCP | UDP | |||||||
| Angra do Heroísmo | 30.4 | 1 | 51.8 | 1 | 12.1 | - | 1.5 | - | 2 | ||
| Aveiro | 30.8 | 5 | 35.2 | 6 | 22.5 | 4 | 3.7 | - | 0.9 | - | 15 |
| Beja | 32.0 | 2 | 8.2 | - | 4.2 | - | 44.0 | 4 | 2.2 | - | 6 |
| Braga | 32.3 | 6 | 28.6 | 5 | 21.2 | 4 | 4.2 | - | 1.0 | - | 15 |
| Bragança | 22.6 | 1 | 33.3 | 2 | 28.3 | 2 | 2.7 | - | 0.8 | - | 5 |
| Castelo Branco | 36.4 | 3 | 22.6 | 2 | 19.9 | 2 | 6.7 | - | 1.1 | - | 7 |
| Coimbra | 40.9 | 6 | 26.7 | 4 | 12.5 | 1 | 7.3 | 1 | 1.2 | - | 12 |
| Évora | 30.3 | 2 | 9.2 | - | 8.0 | - | 43.2 | 4 | 2.6 | - | 6 |
| Faro | 44.6 | 6 | 19.3 | 2 | 6.8 | - | 14.5 | 1 | 2.6 | - | 9 |
| Funchal | 24.9 | 1 | 53.0 | 4 | 13.3 | 1 | 1.5 | - | 1.3 | - | 6 |
| Guarda | 25.2 | 2 | 25.7 | 2 | 32.1 | 2 | 2.9 | - | 1.1 | - | 6 |
| Horta | 34.2 | - | 57.0 | 1 | 4.3 | - | 1.5 | - | 1 | ||
| Leiria | 31.1 | 4 | 31.2 | 4 | 19.4 | 2 | 7.3 | 1 | 1.0 | - | 11 |
| Lisbon | 38.3 | 25 | 16.4 | 10 | 13.2 | 8 | 21.8 | 14 | 2.6 | 1 | 58 |
| Ponta Delgada | 35.4 | 1 | 45.6 | 2 | 11.8 | - | 1.5 | - | 3 | ||
| Portalegre | 41.9 | 3 | 10.1 | - | 13.9 | - | 22.0 | 1 | 1.0 | - | 4 |
| Porto | 40.7 | 18 | 27.0 | 11 | 15.7 | 6 | 8.4 | 3 | 1.5 | - | 38 |
| Santarém | 38.5 | 6 | 19.5 | 3 | 13.9 | 2 | 16.1 | 2 | 1.7 | - | 13 |
| Setúbal | 32.2 | 7 | 8.4 | 1 | 4.4 | - | 44.4 | 9 | 2.8 | - | 17 |
| Viana do Castelo | 25.5 | 2 | 32.8 | 3 | 23.5 | 2 | 6.6 | - | 0.9 | - | 7 |
| Vila Real | 26.3 | 2 | 39.0 | 4 | 18.3 | 1 | 3.1 | - | 0.9 | - | 7 |
| Viseu | 23.0 | 3 | 32.2 | 4 | 31.2 | 4 | 2.3 | - | 0.9 | - | 11 |
| Europe | 46.1 | 1 | 32.2 | 1 | 6.9 | - | 10.1 | - | 0.8 | - | 2 |
| Rest of the World | 6.3 | - | 53.2 | 1 | 33.7 | 1 | 1.4 | - | 0.4 | - | 2 |
| Total | 34.9 | 107 | 24.4 | 73 | 16.0 | 42 | 14.4 | 40 | 1.7 | 1 | 263 |
| Source: Comissão Nacional de Eleições | |||||||||||
Maps
.png) Most voted political force by municipality.
Most voted political force by municipality.
References
- Fundação Mário Soares
- Diário da Républica, 25 de Maio de 1976 - Lista de candidatos eleitos
- "Mário Soares e o ″socialismo na gaveta″". TSF Rádio Notícias (in Portuguese). 10 January 2017. Retrieved 29 June 2020.
- "Constitution of the Portuguese Republic" (PDF). Archived from the original (PDF) on 2016-03-03. Retrieved 2019-12-29.
- "Effective threshold in electoral systems". Trinity College, Dublin. Retrieved 2015-10-21.
- Gallaher, Michael (1992). "Comparing Proportional Representation Electoral Systems: Quotas, Thresholds, Paradoxes and Majorities"
- "Comunicação Política em eleições legislativas em Portugal: uma análise a partir dos cartazes eleitorais (1975-2009)" (PDF). Francisco Teixeira (in Portuguese). Retrieved 12 May 2020.
- "ELEIÇÕES LEGISLATIVAS DE 1983 – PSD". EPHEMERA (in Portuguese). Retrieved 11 May 2020.
- "Comunicação Política em eleições legislativas em Portugal: uma análise a partir dos cartazes eleitorais (1975-2009)" (PDF). Francisco Teixeira (in Portuguese). Retrieved 12 May 2020.
- "Comunicação Política em eleições legislativas em Portugal: uma análise a partir dos cartazes eleitorais (1975-2009)" (PDF). Francisco Teixeira (in Portuguese). Retrieved 12 May 2020.
See also
| Presidential elections | |
|---|---|
| Parliamentary elections |
|
| Local elections | |
| European elections | |
| Referendums | |
| |