Wheatland, California
Wheatland is the second-largest city by population in Yuba County, California, United States. The population was 3,456 at the 2010 census, up from 2,275 at the 2000 census. Wheatland is located 12.5 miles (20 km) southeast of Marysville.[5]
Wheatland, California | |
|---|---|
City | |
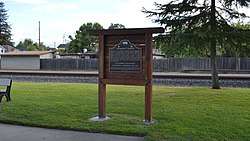
 Johnson's Ranch plaque | |
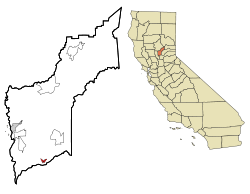
 Location in Yuba County and the state of California | |
 Wheatland, California Location in the United States | |
| Coordinates: 39°00′36″N 121°25′23″W | |
| Country | |
| State | |
| County | Yuba |
| Incorporated | April 23, 1874[1] |
| Area | |
| • Total | 8.13 sq mi (21.05 km2) |
| • Land | 8.12 sq mi (21.04 km2) |
| • Water | 0.01 sq mi (0.02 km2) 0.45% |
| Elevation | 92 ft (28 m) |
| Population (2010) | |
| • Total | 3,456 |
| • Estimate (2019)[4] | 3,873 |
| • Density | 476.85/sq mi (184.12/km2) |
| Time zone | UTC-8 (Pacific) |
| • Summer (DST) | UTC-7 (PDT) |
| ZIP code | 95692 |
| Area code | 530 |
| FIPS code | 06-85012 |
| GNIS feature ID | 1652652 |
| Website | www |
Geography
Wheatland is located at 39°00′36″N 121°25′23″W.[6]
According to the United States Census Bureau, the city has a total area of 1.5 square miles (3.9 km2), 99.55% of it land and 0.45% of it water.
History
Wheatland is located on the Rancho Johnson Mexican land grant. A post office opened in 1866.[5] Wheatland incorporated in 1874.[5]
Wheatland was home to a significant Chinese American community in the 1860s, but all of the Chinese American residents were driven out of town in a series of violent confrontations in February 1886.[7]
In 1888, Edward Duplex was elected Mayor, the first black man to be elected mayor of a Western United States city. His original barbershop stands today on Main street.
Wheatland was the site of the bloody Hop Riot of 1913, considered a notable event in farm labor history that left four men dead, a Wheatland constable shot, and martial law imposed before it was over.[8]
In 2019 Hard Rock Sacramento at Fire Mountain opened in Wheatland.[9]
Climate
| Climate data for Wheatland, California | |||||||||||||
|---|---|---|---|---|---|---|---|---|---|---|---|---|---|
| Month | Jan | Feb | Mar | Apr | May | Jun | Jul | Aug | Sep | Oct | Nov | Dec | Year |
| Record high °F (°C) | 76 (24) |
83 (28) |
89 (32) |
97 (36) |
105 (41) |
113 (45) |
111 (44) |
112 (44) |
113 (45) |
104 (40) |
89 (32) |
79 (26) |
113 (45) |
| Average high °F (°C) | 55 (13) |
62 (17) |
68 (20) |
75 (24) |
83 (28) |
91 (33) |
97 (36) |
96 (36) |
90 (32) |
80 (27) |
65 (18) |
56 (13) |
77 (25) |
| Daily mean °F (°C) | 48 (9) |
53 (12) |
57.5 (14.2) |
64.5 (18.1) |
71.5 (21.9) |
79 (26) |
78 (26) |
79.5 (26.4) |
78 (26) |
68 (20) |
58 (14) |
48 (9) |
65.3 (18.6) |
| Average low °F (°C) | 39 (4) |
43 (6) |
46 (8) |
49 (9) |
55 (13) |
60 (16) |
64 (18) |
62 (17) |
59 (15) |
52 (11) |
45 (7) |
40 (4) |
51 (11) |
| Record low °F (°C) | 20 (−7) |
23 (−5) |
26 (−3) |
32 (0) |
38 (3) |
45 (7) |
50 (10) |
45 (7) |
47 (8) |
32 (0) |
27 (−3) |
17 (−8) |
17 (−8) |
| Source: http://www.weather.com/weather/wxclimatology/monthly/graph/USCA0608 | |||||||||||||
Demographics
| Historical population | |||
|---|---|---|---|
| Census | Pop. | %± | |
| 1880 | 635 | — | |
| 1890 | 630 | −0.8% | |
| 1900 | 492 | −21.9% | |
| 1910 | 481 | −2.2% | |
| 1920 | 435 | −9.6% | |
| 1930 | 479 | 10.1% | |
| 1940 | 496 | 3.5% | |
| 1950 | 581 | 17.1% | |
| 1960 | 813 | 39.9% | |
| 1970 | 1,280 | 57.4% | |
| 1980 | 1,474 | 15.2% | |
| 1990 | 1,631 | 10.7% | |
| 2000 | 2,275 | 39.5% | |
| 2010 | 3,456 | 51.9% | |
| Est. 2019 | 3,873 | [4] | 12.1% |
| U.S. Decennial Census[10] | |||
2010
At the 2010 census Wheatland had a population of 3,456. The population density was 2,326.0 people per square mile (898.1/km2). The racial makeup of Wheatland was 2,633 (76.2%) White, 41 (1.2%) African American, 58 (1.7%) Native American, 203 (5.9%) Asian, 5 (0.1%) Pacific Islander, 278 (8.0%) from other races, and 238 (6.9%) from two or more races. Hispanic or Latino of any race were 620 people (17.9%).[11]
The whole population lived in households, no one lived in non-institutionalized group quarters and no one was institutionalized.
There were 1,219 households, 546 (44.8%) had children under the age of 18 living in them, 667 (54.7%) were opposite-sex married couples living together, 180 (14.8%) had a female householder with no husband present, 68 (5.6%) had a male householder with no wife present. There were 81 (6.6%) unmarried opposite-sex partnerships, and 1 (0.1%) same-sex married couples or partnerships. 245 households (20.1%) were one person and 105 (8.6%) had someone living alone who was 65 or older. The average household size was 2.84. There were 915 families (75.1% of households); the average family size was 3.28.
The age distribution was 1,024 people (29.6%) under the age of 18, 321 people (9.3%) aged 18 to 24, 968 people (28.0%) aged 25 to 44, 783 people (22.7%) aged 45 to 64, and 360 people (10.4%) who were 65 or older. The median age was 33.2 years. For every 100 females, there were 93.0 males. For every 100 females age 18 and over, there were 91.0 males.
There were 1,323 housing units at an average density of 890.4 per square mile, of the occupied units 765 (62.8%) were owner-occupied and 454 (37.2%) were rented. The homeowner vacancy rate was 3.3%; the rental vacancy rate was 5.4%. 2,160 people (62.5% of the population) lived in owner-occupied housing units and 1,296 people (37.5%) lived in rental housing units.
2000
At the 2000 census there were fewer people, 785 households, and 584 families in the city. The population density was 3,007.5 people per square mile (1,155.8/km2). There were 816 housing units at an average density of 1,078.7 per square mile (414.6/km2). The racial makeup of the city was 74.64% White, 1.14% African American, 1.45% Native American, 5.19% Asian, 0.13% Pacific Islander, 11.08% from other races, and 6.37% from two or more races. Hispanic or Latino of any race were 21.23%.[12]
Of the 785 households 40.0% had children under the age of 18 living with them, 52.4% were married couples living together, 16.8% had a female householder with no husband present, and 25.6% were non-families. 21.5% of households were one person and 11.3% were one person aged 65 or older. The average household size was 2.90 and the average family size was 3.37.
The age distribution was 32.9% under the age of 18, 9.7% from 18 to 24, 26.2% from 25 to 44, 18.5% from 45 to 64, and 12.6% 65 or older. The median age was 32 years. For every 100 females, there were 93.8 males. For every 100 females age 18 and over, there were 87.2 males.
The median income for a household in the city was $34,861, and the median family income was $39,375. Males had a median income of $32,656 versus $21,250 for females. The per capita income for the city was $14,889. About 15.8% of families and 19.8% of the population were below the poverty line, including 27.5% of those under age 18 and 6.6% of those age 65 or over.
Government
In the California State Legislature, Wheatland is in the 4th Senate District, represented by Republican Jim Nielsen, and in the 3rd Assembly District, represented by Republican James Gallagher.[13]
In the United States House of Representatives, Wheatland is in California's 3rd congressional district, represented by Democrat John Garamendi.[14]
See also
- Wheatland Hop Riot of 1913
References
- "California Cities by Incorporation Date". California Association of Local Agency Formation Commissions. Archived from the original (Word) on February 21, 2013. Retrieved August 25, 2014.
- "2019 U.S. Gazetteer Files". United States Census Bureau. Retrieved July 1, 2020.
- "Wheatland". Geographic Names Information System. United States Geological Survey. Retrieved November 5, 2014.
- "Population and Housing Unit Estimates". United States Census Bureau. May 24, 2020. Retrieved May 27, 2020.
- Durham, David L. (1998). California's Geographic Names: A Gazetteer of Historic and Modern Names of the State. Clovis, Calif.: Word Dancer Press. p. 575. ISBN 1-884995-14-4.
- U.S. Geological Survey Geographic Names Information System: Wheatland, California
- "Retired service : University of Vermont".
- "Casino and Hotel in Sacramento". Hard Rock Hotel & Casino Sacramento at Fire Mountain. Retrieved 2020-08-10.
- "Census of Population and Housing". Census.gov. Retrieved June 4, 2015.
- "2010 Census Interactive Population Search: CA - Wheatland city". U.S. Census Bureau. Archived from the original on July 15, 2014. Retrieved July 12, 2014.
- "U.S. Census website". United States Census Bureau. Retrieved 2008-01-31.
- "Statewide Database". UC Regents. Archived from the original on February 1, 2015. Retrieved January 12, 2015.
- "California's 3rd Congressional District - Representatives & District Map". Civic Impulse, LLC. Retrieved March 1, 2013.
