Utah's 3rd congressional district
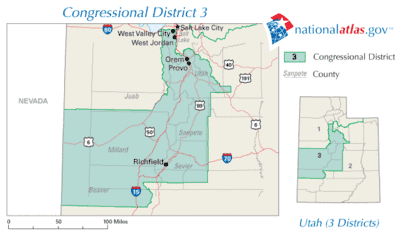
Utah's 3rd congressional district is a congressional district in the United States House of Representatives. It is located in southern and eastern Utah and includes the cities of Orem and Provo.
| Utah's 3rd congressional district | |||
|---|---|---|---|
.tif.png) Utah's 3rd congressional district since January 3, 2013 | |||
| Representative |
| ||
| Median income | $71,367[1] | ||
| Ethnicity |
| ||
| Cook PVI | R+25[2] | ||
The district was created when Utah was awarded an extra congressional seat following the 1980 U.S. Census. Four of its five Representatives have been Republicans; Bill Orton, a Democrat, represented the district from 1991 to 1997. The current Representative is Republican John Curtis, elected in a special election November 7, 2017.
Recent election results from statewide races
Source: "Presidential Election Results, by district" – via swingstateproject.com.
| Year | Office | Result |
|---|---|---|
| 2000 | President | Bush 75 – 24% |
| 2004 | President | Bush 77 – 20% |
| 2008 | President | McCain 67 – 29% |
| 2012 | President | Romney 78 – 20% |
| 2016 | President | Trump 47 – 23% |
List of members representing the district
| Representative | Party | Years | Congress | Electoral history | |
|---|---|---|---|---|---|
| District created January 3, 1983 | |||||
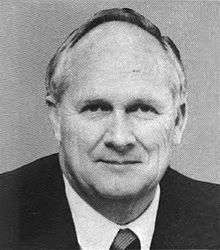 Howard Nielson |
Republican | January 3, 1983 – January 3, 1991 |
98th 99th 100th 101st |
First elected in 1982. Re-elected in 1984. Re-elected in 1986. Re-elected in 1988. Retired. | |
 Bill Orton |
Democratic | January 3, 1991 – January 3, 1997 |
102nd 103rd 104th |
First elected in 1990. Re-elected in 1992. Re-elected in 1994. Lost re-election. | |
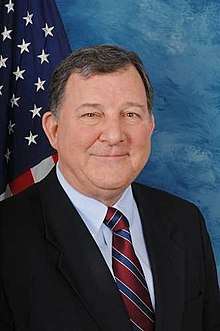 Chris Cannon |
Republican | January 3, 1997 – January 3, 2009 |
105th 106th 107th 108th 109th 110th |
First elected in 1996. Re-elected in 1998. Re-elected in 2000. Re-elected in 2002. Re-elected in 2004. Re-elected in 2006. Lost renomination. | |
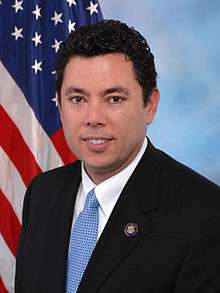 Jason Chaffetz |
Republican | January 3, 2009 – June 30, 2017 |
111th 112th 113th 114th 115th |
First elected in 2008. Re-elected in 2010. Re-elected in 2012. Re-elected in 2014. Re-elected in 2016. Resigned.[3] | |
| Vacant | June 30, 2017 – November 7, 2017 |
115th | |||
.jpg) John Curtis |
Republican | November 7, 2017 – present |
115th 116th |
Elected to finish Chaffetz's term. Re-elected in 2018. | |
Election results
1982
| Party | Candidate | Votes | % | ||
|---|---|---|---|---|---|
| Republican | Howard C. Nielson | 108,478 | 76.86 | ||
| Independent | Henry A. Huish | 32,661 | 23.14 | ||
| Total votes | 141,139 | 100.0 | |||
| Republican win (new seat) | |||||
1984
| Party | Candidate | Votes | % | |
|---|---|---|---|---|
| Republican | Howard C. Nielson (Incumbent) | 138,918 | 74.46 | |
| Democratic | Bruce R. Baird | 46,560 | 24.95 | |
| Libertarian | D.W. Crosby | 1,094 | 0.59 | |
| Total votes | 186,572 | 100.0 | ||
| Republican hold | ||||
1986
| Party | Candidate | Votes | % | |
|---|---|---|---|---|
| Republican | Howard C. Nielson (Incumbent) | 86,599 | 66.58 | |
| Democratic | Dale F. Gardiner | 42,582 | 32.74 | |
| Socialist Workers | David P. Hurst | 893 | 0.68 | |
| Total votes | 130,074 | 100.0 | ||
| Republican hold | ||||
1988
| Party | Candidate | Votes | % | |
|---|---|---|---|---|
| Republican | Howard C. Nielson (Incumbent) | 129,951 | 66.83 | |
| Democratic | Robert W. Stringham | 60,018 | 30.86 | |
| American | E. Dean Christensen | 3,285 | 1.69 | |
| Socialist Workers | Judy Stranahan | 1,207 | 0.62 | |
| Total votes | 194,461 | 100.0 | ||
| Republican hold | ||||
1990
| Party | Candidate | Votes | % | |||
|---|---|---|---|---|---|---|
| Democratic | Bill Orton | 79,163 | 58.35 | |||
| Republican | Karl Snow | 49,452 | 36.45 | |||
| American | Robert J. Smith | 6,542 | 4.82 | |||
| Socialist Workers | Anthony Melvin Dutrow | 519 | 0.38 | |||
| Total votes | 135,676 | 100.0 | ||||
| Democratic gain from Republican | ||||||
1992
| Party | Candidate | Votes | % | |
|---|---|---|---|---|
| Democratic | Bill Orton (Incumbent) | 135,029 | 58.95 | |
| Republican | Richard R. Harrington | 84,019 | 36.68 | |
| Independent | Wayne L. Hill | 5,764 | 2.52 | |
| Independent | Charles M. Wilson | 2,068 | 0.90 | |
| Libertarian | Doug Jones | 1,797 | 0.78 | |
| Socialist Workers | Nels J'Anthony | 384 | 0.17 | |
| Total votes | 229,061 | 100.0 | ||
| Democratic hold | ||||
1994
| Party | Candidate | Votes | % | |
|---|---|---|---|---|
| Democratic | Bill Orton (Incumbent) | 91,505 | 58.98 | |
| Republican | Dixie Thompson | 61,839 | 39.86 | |
| Socialist Workers | Barbara Greenway | 1,802 | 1.16 | |
| Total votes | 155,146 | 100.0 | ||
| Democratic hold | ||||
1996
| Party | Candidate | Votes | % | |||
|---|---|---|---|---|---|---|
| Republican | Chris Cannon | 106,220 | 51.14 | |||
| Democratic | Bill Orton (Incumbent) | 98,178 | 47.27 | |||
| Libertarian | Amy L. Lassen | 2,341 | 1.13 | |||
| Independent | Gerald "Bear" Slothower | 706 | 0.34 | |||
| Socialist Workers | John Phillip Langford | 270 | 0.13 | |||
| Total votes | 207,715 | 100.0 | ||||
| Republican gain from Democratic | ||||||
1998
| Party | Candidate | Votes | % | |
|---|---|---|---|---|
| Republican | Chris Cannon (Incumbent) | 100,830 | 76.90 | |
| Independent American | Will Christensen | 20,720 | 15.80 | |
| Libertarian | Kitty K. Burton | 9,553 | 7.29 | |
| Write-in | 20 | 0.01 | ||
| Total votes | 131,123 | 100.0 | ||
| Republican hold | ||||
2000
| Party | Candidate | Votes | % | |
|---|---|---|---|---|
| Republican | Chris Cannon (Incumbent) | 138,943 | 58.54 | |
| Democratic | Donald Dunn | 88,547 | 37.31 | |
| Independent American | Michael J. Lehman | 5,436 | 2.29 | |
| Libertarian | Kitty K. Burton | 3,570 | 1.50 | |
| Natural Law | Randall Tolpinrud | 852 | 0.36 | |
| Total votes | 237,348 | 100.0 | ||
| Republican hold | ||||
2002
| Party | Candidate | Votes | % | |
|---|---|---|---|---|
| Republican | Chris Cannon (Incumbent) | 103,598 | 67.43 | |
| Democratic | Nancy Jane Woodside | 44,533 | 28.98 | |
| Libertarian | Kitty K. Burton | 5,511 | 3.59 | |
| Write-in | John William Maurin | 1 | 0.00 | |
| Total votes | 153,643 | 100.0 | ||
| Republican hold | ||||
2004
| Party | Candidate | Votes | % | |
|---|---|---|---|---|
| Republican | Chris Cannon (Incumbent) | 173,010 | 63.39 | |
| Democratic | Beau Babka | 88,748 | 32.52 | |
| Constitution | Ronald Winfield | 5,089 | 1.86 | |
| Libertarian | Jim Dexter | 3,691 | 1.35 | |
| Personal Choice | Curtis Darrell James | 2,390 | 0.88 | |
| Total votes | 272,928 | 100.0 | ||
| Republican hold | ||||
2006
| Party | Candidate | Votes | % | |
|---|---|---|---|---|
| Republican | Chris Cannon (Incumbent) | 95,455 | 57.71 | |
| Democratic | Christian Burridge | 53,330 | 32.24 | |
| Constitution | Jim Noorlander | 14,533 | 8.79 | |
| Libertarian | Philip Lear Hallman | 2,080 | 1.26 | |
| Total votes | 165,398 | 100.0 | ||
| Republican hold | ||||
2008
| Party | Candidate | Votes | % | |
|---|---|---|---|---|
| Republican | Jason Chaffetz | 187,035 | 65.61 | |
| Democratic | Bennion Spencer | 80,626 | 28.28 | |
| Constitution | Jim Noorlander | 17,408 | 6.11 | |
| Total votes | 285,069 | 100.0 | ||
| Republican hold | ||||
2010
| Party | Candidate | Votes | % | |
|---|---|---|---|---|
| Republican | Jason Chaffetz (Incumbent) | 139,721 | 72.32 | |
| Democratic | Karen Hyer | 44,320 | 22.94 | |
| Constitution | Douglas Sligting | 4,596 | 2.38 | |
| Libertarian | Jake Shannon | 2,945 | 1.52 | |
| Independent | Joseph L. Puente | 1,604 | 0.83 | |
| Total votes | 193,186 | 100.0 | ||
| Republican hold | ||||
2012
| Party | Candidate | Votes | % | |
|---|---|---|---|---|
| Republican | Jason Chaffetz (Incumbent) | 198,828 | 76.61 | |
| Democratic | Soren Simonsen | 60,719 | 23.39 | |
| Total votes | 259,547 | 100.0 | ||
| Republican hold | ||||
2014
| Party | Candidate | Votes | % | |
|---|---|---|---|---|
| Republican | Jason Chaffetz (Incumbent) | 102,952 | 72.21 | |
| Democratic | Brian Wonnacott | 32,059 | 22.48 | |
| Independent American | Zack Strong | 3,192 | 2.24 | |
| Unaffiliated | Stephen P. Tryon | 2,584 | 1.81 | |
| Unaffiliated | Ben J. Mates | 1,513 | 1.06 | |
| Write-in | David A. Else | 280 | 0.20 | |
| Total votes | 142,580 | 100.0 | ||
| Republican hold | ||||
2016
| Party | Candidate | Votes | % | |
|---|---|---|---|---|
| Republican | Jason Chaffetz (Incumbent) | 209,589 | 73.46 | |
| Democratic | Stephen P. Tryon | 75,716 | 26.54 | |
| Total votes | 285,305 | 100.0 | ||
| Republican hold | ||||
2017 (Special)
| Party | Candidate | Votes | % | |
|---|---|---|---|---|
| Republican | John Curtis | 85,739 | 58.03% | |
| Democratic | Kathie Allen | 37,778 | 25.57% | |
| United Utah | Jim Bennett | 13,745 | 9.30% | |
| Independent | Sean Whalen | 4,550 | 3.08% | |
| Libertarian | Joe Buchman | 3,643 | 2.47% | |
| Independent American | Jason Christensen | 2,286 | 1.55% | |
| Write-in | Brendan Phillips | — | — | |
| Write-in | Russell Paul Roesler | — | — | |
| Total votes | 147,741 | 100.00% | ||
| Republican hold | ||||
2018
| Party | Candidate | Votes | % | |
|---|---|---|---|---|
| Republican | John Curtis (Incumbent) | 174,856 | 67.55% | |
| Democratic | James Courage Singer | 70,686 | 27.31% | |
| Independent American | Gregory C. Duerden | 6,686 | 2.58% | |
| United Utah | Timothy L. Zeidner | 6,630 | 2.56% | |
| Total votes | 258,858 | 100.00 | ||
| Republican hold | ||||
Historical district boundaries
gollark: I wonder what you could do to encourage more trading. More spread out ore veins, so you can set up some giant base somewhere to harvest copper and whatnot.
gollark: For example, people don't really do Botania stuff all that often, so you can sell them that sort of equipment.
gollark: Not everyone makes everything in a kitchen sink pack, mind you.
gollark: Not Krist-as-actual-economy.
gollark: That's just Krist-for-artificial-gating.
See also
- Utah's congressional districts
- List of United States congressional districts
- Utah's 3rd congressional district special election, 2017
References
- Center for New Media & Promotion (CNMP), US Census Bureau. "My Congressional District". www.census.gov.
- "Partisan Voting Index – Districts of the 115th Congress" (PDF). The Cook Political Report. April 7, 2017. Retrieved April 7, 2017.
- Tribune, Courtney Tanner And Lee Davidson The Salt Lake. "Utah sets condensed special election calendar – and it's already started". The Salt Lake Tribune. Retrieved May 22, 2017.
- Clerk of the House of Representatives (May 5, 1983). "Statistics of the Congressional Election of November 2, 1982" (PDF). U.S. Government Printing Office.
- "1984 Election Results" (PDF).
- "1986 Election Results" (PDF).
- "1988 Election Results" (PDF).
- "1990 Election Results" (PDF).
- "1992 Election Results" (PDF).
- "1994 Election Results" (PDF).
- "1996 Election Results" (PDF).
- "1998 Election Results" (PDF).
- "2000 Election Results" (PDF).
- "2002 Election Results" (PDF).
- "2004 Election Results" (PDF).
- "2006 Election Results" (PDF).
- "2008 Election Results" (PDF).
- "2010 Election Results" (PDF).
- "2012 Election Results" (PDF).
- "2014 Election Results".
- 2016 Election Results
- "Utah Election Preliminary Results". State of Utah. Retrieved December 23, 2017.
External links
- "U.S. House, Utah – 3rd District". CQ Politics. Congressional Quarterly, Inc. Retrieved July 9, 2008.
This article is issued from Wikipedia. The text is licensed under Creative Commons - Attribution - Sharealike. Additional terms may apply for the media files.