Timeline of the 2006 Pacific hurricane season
The 2006 Pacific hurricane season was the most active since the 2000 season, producing 21 tropical depressions; 19 of which became tropical storms or hurricanes. The season officially started on May 15, 2006 in the eastern Pacific, designated as the area east of 140°W, and on June 1, 2006 in the central Pacific, which is between the International Date Line and 140°W, and lasted until November 30, 2006. These dates typically limit the period of each year when most tropical cyclones form in the eastern Pacific basin. This timeline documents all the storm formations, strengthening, weakening, landfalls, extratropical transitions, as well as dissipation. The timeline also includes information which was not operationally released, meaning that information from post-storm reviews by the National Hurricane Center, such as information on a storm that was not operationally warned on, have been included.
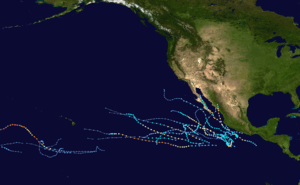
The first storm of the season, Tropical Storm Aletta, formed off the southwest coast of Mexico. After no storms formed in June, the season became active again in July when five named storms developed, including Hurricane Daniel, which was the second strongest storm of the season. Six storms formed during August, including Hurricane Ioke and Hurricane John. September was a relatively inactive month, producing only two storms, of which one was Hurricane Lane. Three storms developed in October and two formed in November; this marked the first time on record when more than one tropical storm developed in the basin during the month of November.
Timeline of storms

| Saffir–Simpson scale | ||||||
| TD | TS | C1 | C2 | C3 | C4 | C5 |
May
.jpg)
- May 15
- The Eastern Pacific hurricane season officially begins.[1]
- May 26
- May 29
- 8:00 p.m. PDT (03:00 UTC May 30) – Tropical Storm Aletta is downgraded to a tropical depression.[2]
- May 30
- 5:00 p.m. PDT (00:00 UTC May 31) – Tropical Depression Aletta becomes a remnant low.[2]
June
- June 1
- The Central Pacific hurricane season officially begins.[1]
- June 3
- 11:00 a.m. PDT (19:00 UTC) – Tropical Depression Two-E forms 145 miles (230 km) southwest of Zihuatanejo, Mexico.[3]
- June 4
- 11:00 p.m. PDT (06:00 UTC June 5) – Tropical Depression Two-E dissipates.[3]
July
- July 10
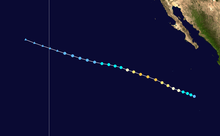
- 5:00 p.m. PDT (00:00 UTC July 11) – Tropical Depression Three-E forms 810 miles (1,295 km) south of Cabo San Lucas, Mexico.[4]
- 11:00 p.m. PDT (06:00 UTC July 11) – Tropical Depression Three-E strengthens into Tropical Storm Bud.[4]
- July 11
- 5:00 p.m. PDT (00:00 UTC July 12) – Tropical Storm Bud strengthens into Hurricane Bud.[4]
- 5:00 p.m. PDT (00:00 UTC July 12) – Tropical Depression Four-E forms 290 miles (465 km) south of Zihuatanejo.[5]
- 11:00 p.m. PDT (06:00 UTC July 12) – Tropical Depression Four-E strengthens into Tropical Storm Carlotta.[5]
- July 12
- July 13
- 11:00 p.m. PDT (06:00 UTC July 14) – Hurricane Bud weakens into a tropical storm.[4]
- July 14
- July 15
- 5:00 a.m. PDT (12:00 UTC) – Hurricane Carlotta weakens into a tropical storm again.[5]
- July 16
- 5:00 a.m. PDT (12:00 UTC) – Tropical Depression Bud becomes a remnant low.[4]
- 5:00 a.m. PDT (12:00 UTC) – Tropical Storm Carlotta weakens into a tropical depression.[5]
- 11:00 a.m. PDT (18:00 UTC) – Tropical Depression Five-E forms about 525 miles (845 km) south-southwest of Manzanillo, Mexico.[6]
- 5:00 p.m. PDT (00:00 UTC July 17) – Tropical Depression Carlotta becomes a remnant low.[5]
- July 17
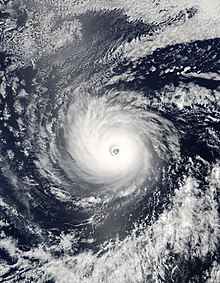
- 5:00 a.m. PDT (12:00 UTC) – Tropical Depression Five-E strengthens into Tropical Storm Daniel.[6]
- July 18
- 11:00 a.m. PDT (18:00 UTC) – Tropical Storm Daniel strengthens into Hurricane Daniel.[6]
- July 19
- 11:00 a.m. PDT (18:00 UTC) – Hurricane Daniel reaches Category 2 intensity.[6]
- July 20
- July 21
- 5:00 a.m. PDT (12:00 UTC) – Tropical Depression Six-E forms about 405 miles (650 km) south-southwest of Acapulco.[7]
- 11:00 p.m. PDT (06:00 UTC July 22) - Tropical Depression Six-E strengthens into Tropical Storm Emilia.[7]
- July 24
- approximately 2:00 a.m. HST (12:00 UTC) – Hurricane Daniel, while a Category 2 storm, crosses the 140°W boundary and moves into the Central Pacific Hurricane Center's area of responsibility.[8]
- 8:00 p.m. HST (06:00 UTC July 25) – Hurricane Daniel weakens to a tropical storm.[8]
- July 25
- 2:00 p.m. HST (00:00 UTC July 26) – Tropical Storm Daniel weakens to a tropical depression.[8]
- July 26
- 2:00 p.m. HST (00:00 UTC July 27) – Tropical Depression Daniel becomes a remnant low.[8]
- July 27
- July 31
- 11:00 a.m. PDT (18:00 UTC) – Tropical Depression Seven-E forms 985 miles (1,575 km) southwest of the southern tip of Baja California.[9]
- 5:00 p.m. PDT (00:00 UTC August 1) – Tropical Depression Seven-E strengthens into Tropical Storm Fabio.[9]
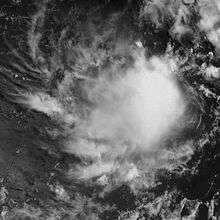
- 5:00 p.m. PDT (00:00 UTC August 1) – Tropical Depression Eight-E forms 415 miles (665 km) southwest of Acapulco, Mexico.[10]
August
- August 1
- August 2
- 5:00 p.m. PDT (00:00 UTC August 3) – Tropical Storm Fabio weakens into a tropical depression.[9]
- August 3
- August 15
- 11:00 a.m. PDT (18:00 UTC) – Tropical Depression Nine-E forms 750 miles (1,205 km) south-southwest of the southern tip of the Baja California Peninsula.[11]
- 5:00 p.m. PDT (00:00 UTC August 16) – Tropical Depression Nine-E strengthens into Tropical Storm Hector.[11]
- August 16
- 11:00 p.m. PDT (06:00 UTC August 17) – Tropical Storm Hector strengthens into Hurricane Hector.[11]
- August 17
- 5:00 p.m. PDT (00:00 UTC August 18) – Hurricane Hector reaches Category 2 intensity.[11]
- August 19
- August 20
- 2:00 a.m. HST (12:00 UTC) – Tropical Depression One-C strengthens into Tropical Storm Ioke.[12]
- 5:00 a.m. PDT (12:00 UTC) – Hurricane Hector weakens to a tropical storm.[11]
- 2:00 p.m. HST (00:00 UTC August 21) – Tropical Storm Ioke strengthens into Hurricane Ioke.[12]
- August 21
- 5:00 a.m. PDT (12:00 UTC) – Tropical Depression Ten-E forms 345 mile (555 km) south-southwest of Acapulco.[13]
- 8:00 a.m. HST (18:00 UTC) – Hurricane Ioke reaches Category 3 intensity.[12]
- 11:00 a.m. PDT (18:00 UTC) – Tropical Depression Ten-E strengthens into Tropical Storm Ileana.[13]
- 2:00 p.m. HST (00:00 UTC August 22) – Hurricane Ioke reaches Category 4 intensity.[12]
- August 22
- 11:00 a.m. PDT (18:00 UTC) – Tropical Storm Ileana strengthens into Hurricane Ileana.
- 5:00 p.m. PDT (00:00 UTC August 23) – Tropical Storm Hector weakens to a tropical depression.[11]
- 11:00 p.m. PDT (06:00 UTC August 23) – Tropical Depression Hector weakens into a low pressure system.[11]
- 11:00 p.m. PDT (06:00 UTC August 23) – Hurricane Ileana reaches Category 2 intensity.[13]
- August 23
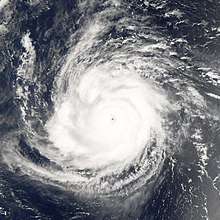
- August 24
- August 25
- 5:00 p.m. PDT (00:00 UTC August 26) – Hurricane Ileana weakens to a tropical storm.[13]
- August 26
- 2:00 a.m. HST (12:00 UTC) – Hurricane Ioke regains Category 5 intensity following earlier weakening.[12]
- approximately 8:00 p.m. HST (06:00 UTC August 27) – Hurricane Ioke, while a Category 5 storm, crosses the International Date Line and out of the area of responsibility of the Central Pacific Hurricane Center.[12]
- August 27
- 5:00 a.m. PDT (12:00 UTC) – Tropical Storm Ileana weakens to a tropical depression.[13]
- 11:00 a.m. PDT (18:00 UTC) – Tropical Depression Ileana becomes a remnant low.[13]
- 5:00 p.m. PDT (00:00 UTC August 28) – Tropical Depression Eleven-E forms 270 miles (435 km) south of Salina Cruz, Mexico.[14]
- August 28
- 5:00 a.m. PDT (12:00 UTC) – Tropical Depression Eleven-E strengthens into Tropical Storm John.[14]
- August 29
- 5:00 a.m. PDT (12:00 UTC) – Tropical Storm John strengthens into Hurricane John.[14]
- 11:00 a.m. PDT (18:00 UTC) – Hurricane John reaches Category 2 intensity.[14]
- 5:00 p.m. PDT (00:00 UTC August 30) – Hurricane John reaches Category 3 intensity.[14]
- 5:00 p.m. PDT (00:00 UTC August 30) – Tropical Depression Twelve-E forms 600 miles (965 km) southwest of the southern tip of the Baja California Peninsula.[15]
- 11:00 p.m. PDT (06:00 UTC August 30) – Tropical Depression Twelve-E strengthens into Tropical Storm Kristy.[15]
- August 30
- August 31
September
- September 1
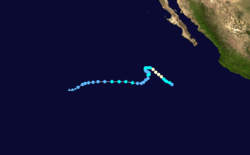
- 7:00 p.m. PDT (02:00 UTC September 2) – Hurricane John makes landfall over Cabo del Este, Baja California Sur with 110 mph (175 km/h) winds.[nb 1]
- September 2
- September 3
- September 4
- 11:00 a.m. PDT (18:00 UTC) – Tropical Depression John dissipates.[14]
- September 5
- 5:00 a.m. PDT (12:0000 UTC) – Tropical Depression Kristy strengthens into a tropical storm for a third time.[15]
- September 6
- 5:00 a.m. PDT (12:00 UTC) – Tropical Storm Kristy again weakens to a tropical depression.[15]
- September 7
- 11:00 p.m. PDT (06:00 UTC September 8) – Tropical Depression Kristy becomes a remnant low.[15]
- September 13
- September 15
- 5:00 a.m. PDT (12:00 UTC) – Tropical Storm Lane strengthens into Hurricane Lane.[16]
- 5:00 p.m. PDT (00:00 UTC September 16) – Hurricane Lane reaches Category 2 intensity.[16]
- 5:00 p.m. PDT (00:00 UTC September 16) – Tropical Depression Fourteen-E forms about 510 miles (815 km) southwest of Cabo San Lucas, Mexico.[17]
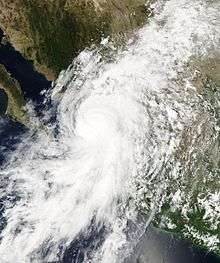
- 11:00 p.m. PDT (06:00 UTC September 16) – Hurricane Lane reaches Category 3 intensity, becoming the fifth major hurricane of the season.[16]
- September 16
- 5:00 a.m. PDT (12:00 UTC) – Tropical Depression Fourteen-E strengthens into Tropical Storm Miriam.[17]
- 12:15 p.m. PDT (19:15 UTC) – Hurricane Lane makes landfall on the coast of Sinaloa state along Peninsula de Guevedo, Mexico with 125 mph (205 km/h) winds.[16]
- 11:00 p.m. PDT (06:00 UTC September 17) – Hurricane Lane weakens to a tropical storm.[16]
- September 17
- September 18
- 5:00 a.m. PDT (12:00 UTC) – Tropical Depression Miriam weakens into a low.[17]
- 2:00 p.m. HST (00:00 UTC September 19) – Tropical Depression Two-C forms in the Pacific Ocean near 9.8°N 151.5°W.[18]
- September 20
- 2:00 p.m. HST (00:00 UTC September 21) – Tropical Depression Two-C degenerates into a tropical disturbance with no low-level circulation center.[18]
- September 26
- 8:00 a.m. HST (18:00 UTC) – Tropical Depression Three-C forms 710 miles (1,145 km) west-southwest of Johnston Atoll.[19]
- 8:00 p.m. HST (09:60 UTC September 27) – Tropical Depression Three-C dissipates.[19]
October
- October 8
- 5:00 p.m. PDT (00:00 UTC October 9) – Tropical Depression Fifteen-E forms about 770 miles (1230 km) southwest of Cabo San Lucas.[20]
- October 9
- 5:00 a.m. PDT (12:00 UTC) – Tropical Depression Fifteen-E strengthens into Tropical Storm Norman.[20]
- 11:00 a.m. PDT (18:00 UTC) – Tropical Depression Sixteen-E forms 1365 miles (2185 km) west-southwest of the southern tip of Baja California.[21]
- 11:00 p.m. PDT (06:00 UTC October 10) – Tropical Depression Sixteen-E strengthens into Tropical Storm Olivia.[21]
- October 10
- 11:00 a.m. PDT (18:00 UTC) – Tropical Storm Norman weakens to a tropical depression.[20]
- October 11
- October 12
- 5:00 p.m. PDT (00:00 UTC October 13) – Tropical Depression Olivia weakens into a low, which is later absorbed by the circulation of Norman.[21]
- October 13
- October 14
- 8:00 a.m. HST (18:00 UTC) – Tropical Depression Four-C degenerates into a tropical disturbance with low-level cloud swirl.[22]
- 5:00 p.m. PDT (00:00 UTC October 15) – Tropical Depression Norman regenerates 205 miles (325 km) south-southeast of Manzanillo, Mexico.[20]
- October 15
- 5:00 p.m. PDT (00:00 UTC October 16) – Tropical Depression Norman dissipates.[20]
- October 20
- 11:00 p.m. PDT (06:00 UTC October 21) – Tropical Depression Seventeen-E forms about 265 miles (465 km) south-southwest of Manzanillo, Mexico.[23]
- October 21
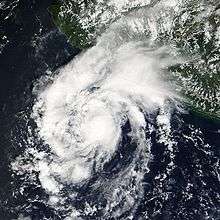
- 5:00 a.m. PDT (12:00 UTC) – Tropical Depression Seventeen-E strengthens into Tropical Storm Paul.[23]
- October 22
- 5:00 p.m. PDT (00:00 UTC October 23) – Tropical Storm Paul strengthens into Hurricane Paul.[23]
- 6:00 p.m. PDT (06:00 UTC October 23) – Hurricane Paul reaches Category 2 intensity.[23]
- October 24
- 5:00 a.m. PDT (12:00 UTC) – Hurricane Paul weakens to a tropical storm.[23]
- October 25
- 5:00 p.m. PDT (00:00 UTC October 26) – Tropical Storm Paul weakens to a tropical depression.[23]
- 9:00 p.m. PDT (04:00 UTC October 26) – Tropical Depression Paul makes landfall near the southern end of Isla Altamura with 30 mph (45 km/h) winds.[23]
- 11:00 p.m. PDT (06:00 UTC October 26) – Tropical Depression Paul becomes a remnant low.[23]
- October 26
- 5:00 a.m. PDT (12:00 UTC) – Tropical Depression Eighteen-E forms 155 miles (250 km) south of Manzanillo, Mexico.[24]
- October 27
- 5:00 p.m. PDT (00:00 UTC October 28) – Tropical Depression Eighteen-E becomes a remnant low.[24]
November
- November 7
- 10:00 p.m. PST (06:00 UTC November 8) – Tropical Depression Nineteen-E forms 445 miles (715 km) south of Manzanillo, Mexico.[25]
- November 8
- 10:00 p.m. PST (06:00 UTC November 9) – Tropical Depression Nineteen-E strengthens into Tropical Storm Rosa.[25]
- November 9
- 4:00 p.m. PST (00:00 UTC November 10) – Tropical Storm Rosa weakens to a tropical depression.[25]
- November 10
- November 11
- 10:00 a.m. PST (18:00 UTC) – Tropical Depression Twenty-E dissipates.[26]
- November 13
- 10:00 a.m. PST (18:00 UTC) – Tropical Depression Twenty-one-E forms about 465 miles (740 km) south of Manzanillo.[27]
- November 14
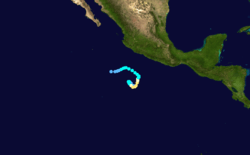
- 4:00 a.m. PST (12:00 UTC) – Tropical Depression Twenty-one-E strengthens into Tropical Storm Sergio.[27]
- November 15
- November 16
- 10:00 p.m. PST (06:00 UTC November 17) – Hurricane Sergio weakens to a tropical storm.[27]
- November 19
- 4:00 p.m. PST (00:00 UTC November 20) – Tropical Storm Sergio weakens to a tropical depression.[27]
- November 20
- 4:00 p.m. PST (00:00 UTC November 21) – Tropical Depression Sergio dissipates.[27]
See also
- 2006 Pacific hurricane season
- Pacific hurricane season
- Timeline of the 2006 Atlantic hurricane season
- Timeline of the 2006 Pacific typhoon season
Notes
- The figures for maximum sustained winds and position estimates are rounded to the nearest 5 units (knots, miles, or kilometers), following the convention used in the National Hurricane Center's operational products for each storm. All other units are rounded to the nearest digit.
References
- Atlantic Oceanographic and Meteorological Laboratory, Hurricane Research Division. "Frequently Asked Questions: When is hurricane season?". National Oceanic and Atmospheric Administration. Archived from the original on 2006-07-18. Retrieved 2008-08-21.
- Pasch, Richard J./National Hurricane Center (2006-07-15). "Tropical Cyclone Report: Tropical Storm Aletta" (PDF). National Oceanic and Atmospheric Administration. Retrieved 2006-11-22.
- Avila, Lixion A./National Hurricane Center (2006-07-05). "Tropical Cyclone Report: Tropical Depression Two-E" (PDF). National Oceanic and Atmospheric Administration. Retrieved 2006-11-22.
- Knabb, Richard D./National Hurricane Center (2006-11-20). "Tropical Cyclone Report: Hurricane Bud" (PDF). National Oceanic and Atmospheric Administration. Retrieved 2006-11-22.
- Franklin, James L./National Hurricane Center (2006-09-04). "Tropical Cyclone Report: Hurricane Carlotta" (PDF). National Oceanic and Atmospheric Administration. Retrieved 2006-11-22.
- Beven, Jack/National Hurricane Center (2006-11-30). "Tropical Cyclone Report: Hurricane Daniel" (PDF). National Oceanic and Atmospheric Administration. Retrieved 2006-12-04.
- Stewart, Stacy R./National Hurricane Center (2006-11-29). "Tropical Cyclone Report: Tropical Storm Emilia" (PDF). National Oceanic and Atmospheric Administration. Retrieved 2006-12-04.
- Central Pacific Hurricane Center. "Hurricane Daniel (24–26 July 2006)". National Oceanic and Atmospheric Administration. Retrieved 2006-12-01.
- Rhome, Jamie R./National Hurricane Center (2006-09-13). "Tropical Cyclone Report: Tropical Storm Fabio" (PDF). National Oceanic and Atmospheric Administration. Retrieved 2006-11-22.
- Mainelli, Michelle/National Hurricane Center (2006-08-23). "Tropical Cyclone Report: Tropical Storm Gilma" (PDF). National Oceanic and Atmospheric Administration. Retrieved 2006-11-22.
- Brown, Daniel P./National Hurricane Center (2006-09-28). "Tropical Cyclone Report: Hurricane Hector" (PDF). National Oceanic and Atmospheric Administration. Retrieved 2006-11-22.
- Central Pacific Hurricane Center. "Hurricane Ioke (20–27 August 2006)". National Oceanic and Atmospheric Administration. Retrieved 2007-05-20.
- Blake, Eric S./National Hurricane Center (2006-10-04). "Tropical Cyclone Report: Hurricane Ileana" (PDF). National Oceanic and Atmospheric Administration. Retrieved 2006-11-22.
- Pasch, Richard J./National Hurricane Center (2006-11-16). "Tropical Cyclone Report: Hurricane John" (PDF). National Oceanic and Atmospheric Administration. Retrieved 2006-11-22.
- Avila, Lixion A./National Hurricane Center (2006-10-12). "Tropical Cyclone Report: Hurricane Kristy" (PDF). National Oceanic and Atmospheric Administration. Retrieved 2006-11-22.
- Knabb, Richard D./National Hurricane Center (2006-11-30). "Tropical Cyclone Report: Hurricane Lane" (PDF). National Oceanic and Atmospheric Administration. Retrieved 2006-12-01.
- Franklin, James L./National Hurricane Center (2006-10-29). "Tropical Cyclone Report: Tropical Storm Miriam" (PDF). National Oceanic and Atmospheric Administration. Retrieved 2006-11-22.
- Central Pacific Hurricane Center. "Tropical Depression 02-C (18–20 September 2006)". National Oceanic and Atmospheric Administration. Retrieved 2007-05-20.
- Central Pacific Hurricane Center. "Tropical Depression 03-C (26–27 September 2006)". National Oceanic and Atmospheric Administration. Retrieved 2007-05-20.
- Beven, Jack/National Hurricane Center (2006-11-30). "Tropical Cyclone Report: Tropical Storm Norman" (PDF). National Oceanic and Atmospheric Administration. Retrieved 2006-12-04.
- Stewart, Stacy R./National Hurricane Center (2006-10-28). "Tropical Cyclone Report: Tropical Storm Olivia" (PDF). National Oceanic and Atmospheric Administration. Retrieved 2006-11-22.
- Central Pacific Hurricane Center. "Tropical Depression 04-C (13–14 October 2006)". National Oceanic and Atmospheric Administration. Retrieved 2007-05-20.
- Rhome, Jamie R. and Berg, Robert J./National Hurricane Center (2006-11-20). "Tropical Cyclone Report: Hurricane Paul" (PDF). National Oceanic and Atmospheric Administration. Retrieved 2006-11-30.CS1 maint: multiple names: authors list (link)
- Mainelli, Michelle/National Hurricane Center (2006-11-13). "Tropical Cyclone Report: Tropical Depression Eighteen-E" (PDF). National Oceanic and Atmospheric Administration. Retrieved 2006-11-22.
- Brown, Daniel P./National Hurricane Center (2006-11-27). "Tropical Cyclone Report: Tropical Storm Rosa" (PDF). National Oceanic and Atmospheric Administration. Retrieved 2006-11-28.
- Blake, Eric S./National Hurricane Center (2006-11-14). "Tropical Cyclone Report: Tropical Depression Twenty-E" (PDF). National Oceanic and Atmospheric Administration. Retrieved 2006-11-22.
- Pasch, Richard J. and Roberts, David P./National Hurricane Center (2006-11-29). "Tropical Cyclone Report: Hurricane Sergio" (PDF). National Oceanic and Atmospheric Administration. Retrieved 2006-11-30.CS1 maint: multiple names: authors list (link)
| Preceded by 2005 |
Pacific hurricane seasons timelines 2006 |
Succeeded by 2007 |