Process control
Automatic process control in continuous production processes is a combination of control engineering and chemical engineering disciplines that uses industrial control systems to achieve a production level of consistency, economy and safety which could not be achieved purely by human manual control. It is implemented widely in industries such as oil refining, pulp and paper manufacturing, chemical processing and power generating plants.
There is a wide range of size, type and complexity, but it enables a small number of operators to manage complex processes to a high degree of consistency. The development of large automatic process control systems was instrumental in enabling the design of large high volume and complex processes, which could not be otherwise economically or safely operated.
The applications can range from controlling the temperature and level of a single process vessel, to a complete chemical processing plant with several thousand control loops.
History
Early process control breakthroughs came most frequently in the form of water control devices. Ktesibios of Alexandria is credited for inventing float valves to regulate water level of water clocks in the 3rd Century BC. In the 1st Century AD, Heron of Alexandria invented a water valve similar to the fill valve used in modern toilets.[1]
Later process controls inventions involved basic physics principles. In 1620, Cornlis Drebbel invented a bimetallic thermostat for controlling the temperature in a furnace. In 1681, Denis Papin discovered the pressure inside a vessel could be regulated by placing weights on top of the vessel lid.[1] In 1745, Edmund Lee created the fantail to improve windmill efficiency; a fantail was a smaller windmill placed 90° of the larger fans to keep the face of the windmill pointed directly into the oncoming wind.
With the dawn of the Industrial Revolution in the 1760s, process controls inventions were aimed to replace human operators with mechanized processes. In 1784, Oliver Evans created a water-powered flourmill which operated using buckets and screw conveyors. Henry Ford applied the same theory in 1910 when the assembly line was created to decrease human intervention in the automobile production process.[1]
For continuously variable process control it was not until 1922 that a formal control law for what we now call PID control or three-term control was first developed using theoretical analysis, by Russian American engineer Nicolas Minorsky.[2] Minorsky was researching and designing automatic ship steering for the US Navy and based his analysis on observations of a helmsman. He noted the helmsman steered the ship based not only on the current course error, but also on past error, as well as the current rate of change;[3] this was then given a mathematical treatment by Minorsky.[4] His goal was stability, not general control, which simplified the problem significantly. While proportional control provided stability against small disturbances, it was insufficient for dealing with a steady disturbance, notably a stiff gale (due to steady-state error), which required adding the integral term. Finally, the derivative term was added to improve stability and control.
Development of modern process control operations

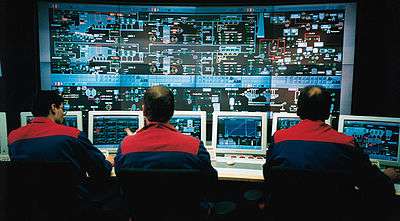
Process control of large industrial plants has evolved through many stages. Initially, control would be from panels local to the process plant. However this required a large manpower resource to attend to these dispersed panels, and there was no overall view of the process. The next logical development was the transmission of all plant measurements to a permanently-manned central control room. Effectively this was the centralisation of all the localised panels, with the advantages of lower manning levels and easier overview of the process. Often the controllers were behind the control room panels, and all automatic and manual control outputs were transmitted back to plant. However, whilst providing a central control focus, this arrangement was inflexible as each control loop had its own controller hardware, and continual operator movement within the control room was required to view different parts of the process.
With the coming of electronic processors and graphic displays it became possible to replace these discrete controllers with computer-based algorithms, hosted on a network of input/output racks with their own control processors. These could be distributed around plant, and communicate with the graphic display in the control room or rooms. The distributed control system was born.
The introduction of DCSs allowed easy interconnection and re-configuration of plant controls such as cascaded loops and interlocks, and easy interfacing with other production computer systems. It enabled sophisticated alarm handling, introduced automatic event logging, removed the need for physical records such as chart recorders, allowed the control racks to be networked and thereby located locally to plant to reduce cabling runs, and provided high level overviews of plant status and production levels.
Hierarchy

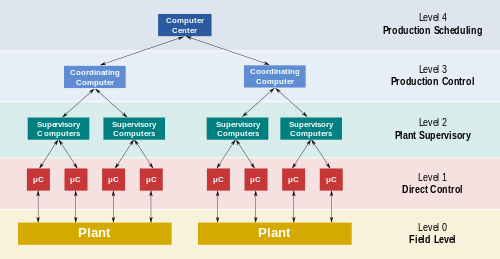
The accompanying diagram is a general model which shows functional manufacturing levels in a large process using processor and computer-based control.
Referring to the diagram: Level 0 contains the field devices such as flow and temperature sensors (process value readings - PV), and final control elements (FCE), such as control valves; Level 1 contains the industrialised Input/Output (I/O) modules, and their associated distributed electronic processors; Level 2 contains the supervisory computers, which collate information from processor nodes on the system, and provide the operator control screens; Level 3 is the production control level, which does not directly control the process, but is concerned with monitoring production and monitoring targets; Level 4 is the production scheduling level.
Control model
To determine the fundamental model for any process, the inputs and outputs of the system are defined differently than for other chemical processes.[5] The balance equations are defined by the control inputs and outputs rather than the material inputs. The control model is a set of equations used to predict the behavior of a system and can help determine what the response to change will be. The state variable (x) is a measurable variable that is a good indicator of the state of the system, such as temperature (energy balance), volume (mass balance) or concentration (component balance). Input variable (u) is a specified variable that commonly include flow rates.
It is important to note that the entering and exiting flows are both considered control inputs. The control input can be classified as a manipulated, disturbance, or unmonitored variable. Parameters (p) are usually a physical limitation and something that is fixed for the system, such as the vessel volume or the viscosity of the material. Output (y) is the metric used to determine the behavior of the system. The control output can be classified as measured, unmeasured, or unmonitored.
Types
Processes can be characterized as batch, continuous, or hybrid [6]. Batch applications require that specific quantities of raw materials be combined in specific ways for particular duration to produce an intermediate or end result. One example is the production of adhesives and glues, which normally require the mixing of raw materials in a heated vessel for a period of time to form a quantity of end product. Other important examples are the production of food, beverages and medicine. Batch processes are generally used to produce a relatively low to intermediate quantity of product per year (a few pounds to millions of pounds).
A continuous physical system is represented through variables that are smooth and uninterrupted in time. The control of the water temperature in a heating jacket, for example, is an example of continuous process control. Some important continuous processes are the production of fuels, chemicals and plastics. Continuous processes in manufacturing are used to produce very large quantities of product per year (millions to billions of pounds). Such controls use feedback such as in the PID controller A PID Controller includes proportional, integrating, and derivative controller functions.
Applications having elements of batch and continuous process control are often called hybrid applications.
Control loops

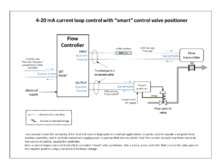
The fundamental building block of any industrial control system is the control loop, which controls just one process variable. An example is shown in the accompanying diagram, where the flow rate in a pipe is controlled by a PID controller, assisted by what is effectively a cascaded loop in the form of a valve servo-controller to ensure correct valve positioning.
Some large systems may have several hundreds or thousands of control loops. In complex processes the loops are interactive, so that the operation of one loop may affect the operation of another. The system diagram for representing control loops is a Piping and instrumentation diagram.
Commonly used controllers are programmable logic controller (PLC), Distributed Control System (DCS) or SCADA.

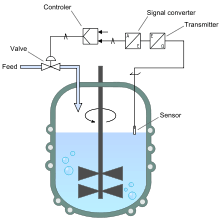
A further example is shown. If a control valve were used to hold level in a tank, the level controller would compare the equivalent reading of a level sensor to the level setpoint and determine whether more or less valve opening was necessary to keep the level constant. A cascaded flow controller could then calculate the change in the valve position.
Economic advantages
The economic nature of many products manufactured in batch and continuous processes require highly efficient operation due to thin margins. The competing factor in process control is that products must meet certain specifications in order to be satisfactory. These specifications can come in two forms: a minimum and maximum for a property of the material or product, or a range within which the property must be.[7] All loops are susceptible to disturbances and therefore a buffer must be used on process set points to ensure disturbances do not cause the material or product to go out of specifications. This buffer comes at an economic cost (i.e. additional processing, maintaining elevated or depressed process conditions, etc.).
Process efficiency can be enhanced by reducing the margins necessary to ensure product specifications are met.[7] This can be done by improving the control of the process to minimize the effect of disturbances on the process. The efficiency is improved in a two step method of narrowing the variance and shifting the target.[7] Margins can be narrowed through various process upgrades (i.e. equipment upgrades, enhanced control methods, etc.). Once margins are narrowed, an economic analysis can be done on the process to determine how the set point target is to be shifted. Less conservative process set points lead to increased economic efficiency.[7] Effective process control strategies increase the competitive advantage of manufacturers who employ them.
See also
- Actuator
- Automation
- Automatic control
- Check weigher
- Closed-loop controller
- Control engineering
- Control loop
- Control panel
- Control system
- Control theory
- Controllability
- Controller (control theory)
- Cruise control
- Current loop
- Digital control
- Distributed control system
- Feedback
- Feed-forward
- Fieldbus
- Flow control valve
- Fuzzy control system
- Gain scheduling
- Intelligent control
- Laplace transform
- Linear parameter-varying control
- Measurement instruments
- Model predictive control
- Negative feedback
- Nonlinear control
- Open-loop controller
- Operational historian
- Proportional control
- PID controller
- Piping and instrumentation diagram
- Positive feedback
- Process capability
- Programmable logic controller
- Regulator (automatic control)
- SCADA
- Servomechanism
- Setpoint
- Signal-flow graph
- Simatic S5 PLC
- Sliding mode control
- Temperature control
- Transducer
- Valve
- Watt governor
- Process control monitoring
References
- Young, William Y; Svrcek, Donald P; Mahoney, Brent R (2014). "1: A Brief History of Control and Simulation". A Real Time Approach to Process Control (3 ed.). Chichester, West Sussex, United Kingdom: John Wiley & Sons Inc. pp. 1–2. ISBN 978-1119993872.
- Minorsky, Nicolas (1922). "Directional stability of automatically steered bodies". J. Amer. Soc. Naval Eng. 34 (2): 280–309. doi:10.1111/j.1559-3584.1922.tb04958.x.CS1 maint: ref=harv (link)
- Bennett 1993, p. 67
- Bennett, Stuart (1996). "A brief history of automatic control" (PDF). IEEE Control Systems Magazine. 16 (3): 17–25. doi:10.1109/37.506394. Archived from the original (PDF) on 2016-08-09. Retrieved 2018-03-25.
- Bequette, B. Wayne (2003). Process control: Modeling, Design, and Simulation (Prentice-Hall International series in the physical and chemical engineering science. ed.). Upper Saddle River, N.J.: Prentice Hall PTR. pp. 57–58. ISBN 978-0133536409.
- https://www.mindsmapped.com/difference-between-continuous-and-batch-process/
- Smith, C L (March 2017). "Process Control for the Process Industries - Part 2: Steady State Characteristics". Chemical Engineering Progress: 67–73.
Further reading
- Walker, Mark John (2012-09-08). The Programmable Logic Controller: its prehistory, emergence and application (PDF) (PhD thesis). Department of Communication and Systems Faculty of Mathematics, Computing and Technology: The Open University. Archived (PDF) from the original on 2018-06-20. Retrieved 2018-06-20.