Poverty in Peru
Poverty in Peru has rapidly declined since the start of the 21st century, as a result of prosperity from the international market, tourism, low inflation, greater economic opportunities, and neoliberal economic policy, at one of the fastest rates in South America. Poverty decreased from 58.7% in 2004 to 20.5% in 2018, or from 14.9 million people in poverty to fewer than 6.8 million people in 2018, with millions of Peruvians rising out of poverty according to the Instituto Nacional de Estadística e Informática (INEI).[1]

As of 2018, 20.5% of the population of Peru is at or below the poverty line, constituting around 6,765,000 people. Only 2.8% (~924,000 people) of the Peruvian population find themselves in extreme poverty. According to the INEI, extreme poverty is defined as individuals who earn less than US$80 per month (S./264 PEN), and the minimum living wage is defined as US$415 per month.
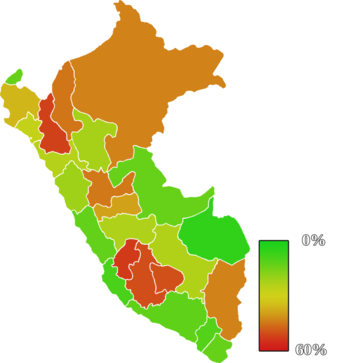
Poverty in Peru is especially present in underdeveloped and most inland regions of Peru, particularly Huancavelica and Cajamarca, as a result of little economic opportunity and availability of capital in those regions. Areas with a high development index, such as Lima, Moquegua and Ica, enjoy relatively low poverty as a result of economic opportunity.
Peru is one of the countries in the world that has seen the fastest reduction of poverty, partly due to sound economic policy and growth.[2]
Unemployment and social mobility

Peru's National Institute of Informational Data (INEI) reported around 686,300 able Peruvians as unemployed.
Poverty rate in Peru by region
| Ranking | Region | 2018 |
|---|---|---|
| Total | Perú | 20.5% |
| 1 | Madre de Dios | 4.2% |
| 2 | Ica | 8.1% |
| 3 | Moquegua | 9.6% |
| 4 | Arequipa | 11.7% |
| 5 | Lima | 12.0% |
| 6 | Tacna | 12.8% |
| 7 | Tumbes | 13.0% |
| 8 | Ucayali | 13.2% |
| 9 | Ancash | 22.0% |
| 10 | San Martín | 23.1% |
| 11 | Junín | 24.5% |
| 12 | Cusco | 25.0% |
| 13 | La Libertad | 25.6% |
| 14 | Lambayeque | 28.0% |
| 15 | Piura | 34.9% |
| 16 | Pasco | 37.5% |
| 17 | Puno | 42.9% |
| 18 | Loreto | 43.1% |
| 19 | Huánuco | 44.9% |
| 20 | Amazonas | 45.0% |
| 21 | Apurímac | 51.2% |
| 22 | Ayacucho | 51.5% |
| 23 | Cajamarca | 53.5% |
| 24 | Huancavelica | 54.5% |
| Source: Instituto Nacional de Estadística e Informática del Perú | ||
Other dimensions of poverty
Basic access to utilities has relatively improved in Peru throughout since 2000, as seen through the percentage of the population lacking basic utilities declining.[3]
| Year | Water | Basic Sanitation | Overcrowdedness |
|---|---|---|---|
| 2007 | 28.0% | 42.0% | 12.3% |
| 2008 | 27.6% | 40.4% | 11.6% |
| 2009 | 25.9% | 38.3% | 11.0% |
| 2010 | 23.8% | 36.4% | 9.6% |
| 2011 | 23.2% | 34.9% | 9.6% |
| 2012 | 17.7% | 33.4% | 8.9% |
| 2013 | 16.9% | 33.0% | 8.3% |
| 2014 | 14.3% | 32.3% | 7.6% |
| 2015 | 14.2% | 31.5% | 7.4% |
| 2016 | 12.0% | 30.6% | 7.3% |
| 2017 | 12.0% | 29.7% | 7.0% |
| Source: INEI (2017) | |||
References
- "Perfil de la pobreza 2012, Perú" (PDF). INEI. Retrieved 2019-12-23.
- "Poverty headcount ratio at national poverty lines (% of population) - Peru | Data". data.worldbank.org. Retrieved 2019-12-23.
- "Evolución de la Pobreza monetaria 2007-2017 – Instituto Peruano de Economía" (in Spanish). Retrieved 2020-02-02.
- Perfil de la Pobreza 2012, Perú
- Pobreza por Departamentos 2010, Perú
- Pobreza por Distritos 2007, Perú
.jpg)