Pierson, Florida
Pierson is a town in Volusia County, Florida, United States. The population was 1,736 at the 2010 census.[5]
Pierson, Florida | |
|---|---|
| Town of Pierson | |
 Seal | |
| Motto(s): Fern Capital of the World | |
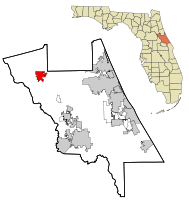
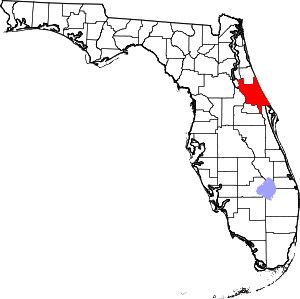
 Location in Volusia County and the state of Florida | |
| Coordinates: 29°14′30″N 81°27′24″W | |
| Country | United States of America |
| State | Florida |
| County | Volusia |
| Settled | 1876 |
| Incorporated (town) | 1926 |
| Government | |
| • Type | Mayor-Council |
| • Mayor | James Sowell |
| Area | |
| • Total | 10.90 sq mi (28.24 km2) |
| • Land | 10.19 sq mi (26.39 km2) |
| • Water | 0.71 sq mi (1.85 km2) |
| Elevation | 75 ft (23 m) |
| Population (2010) | |
| • Total | 1,736 |
| • Estimate (2019)[2] | 1,893 |
| • Density | 185.77/sq mi (71.72/km2) |
| Time zone | UTC-5 (Eastern (EST)) |
| • Summer (DST) | UTC-4 (EDT) |
| ZIP code | 32180 |
| Area code(s) | 386 |
| FIPS code | 12-56425[3] |
| GNIS feature ID | 0288798[4] |
| Website | http://www.townofpierson.org |
Pierson bills itself as the "Fern Capital of the World". The town is heavily reliant on agriculture which mainly consists of fern growing.[6] Its ferns are exported worldwide for use in floral arrangements and other decorations.
Geography
Pierson is located at 29°14′30″N 81°27′24″W (29.241713, -81.456594).[7] It is the northwesternmost incorporated town in Volusia County. U.S. Route 17 and County Road 3 (former US 17) pass through the town.
According to the United States Census Bureau, the town has a total area of 8.7 square miles (23 km2), of which 8.1 square miles (21 km2) is land and 0.6 square miles (1.6 km2) (6.86%) is water.
Notable person
- Chipper Jones, Major League Baseball star, and 2018 National Baseball Hall of Fame and Museum inductee, for the Atlanta Braves.[8]
Demographics
| Historical population | |||
|---|---|---|---|
| Census | Pop. | %± | |
| 1930 | 624 | — | |
| 1940 | 541 | −13.3% | |
| 1950 | 657 | 21.4% | |
| 1960 | 716 | 9.0% | |
| 1970 | 654 | −8.7% | |
| 1980 | 1,085 | 65.9% | |
| 1990 | 2,988 | 175.4% | |
| 2000 | 2,596 | −13.1% | |
| 2010 | 1,736 | −33.1% | |
| Est. 2019 | 1,893 | [2] | 9.0% |
| U.S. Decennial Census[9] | |||
As of the 2010 United States Census, there were 1,736 people living in the town. The racial makeup of the town was 39.9% White, 4.6% Black, 0.3% Native American, 0.3% Asian, 0.1% from some other race and 0.6% from two or more races. 54.1% were Hispanic or Latino of any race.
As of the census[3] of 2000, there were 2,596 people, 484 households, and 378 families living in the town. The population density was 319.1 inhabitants per square mile (123.1/km2). There were 514 housing units at an average density of 63.2 per square mile (24.4/km2). The racial makeup of the town was 81.93% White, 4.93% African American, 0.27% Native American, 0.08% Asian, 11.48% from other races, and 1.31% from two or more races. Hispanic or Latino of any race were 62.44% of the population.
There were 484 households, out of which 43.2% had children under the age of 18 living with them, 61.2% were married couples living together, 10.5% had a female householder with no husband present, and 21.9% were non-families. 18.0% of all households were made up of individuals, and 9.5% had someone living alone who was 65 years of age or older. The average household size was 3.35 and the average family size was 3.71.
In the town, the population was spread out, with 21.7% under the age of 18, 18.7% from 18 to 24, 38.4% from 25 to 44, 14.2% from 45 to 64, and 6.9% who were 65 years of age or older. The median age was 28 years. For every 100 females, there were 142.6 males. For every 100 females age 18 and over, there were 149.9 males.
The median income for a household in the town was $26,773, and the median income for a family was $27,461. Males had a median income of $30,247 versus $14,605 for females. The per capita income for the town was $12,450. About 22.8% of families and 33.6% of the population were below the poverty line, including 39.9% of those under age 18 and 21.8% of those age 65 or over.
Town Hall

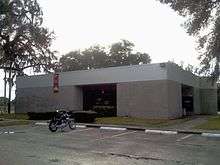
The Town Hall for Pierson is in a building shared with the local branch of BB&T bank. [10]
| Name | Office |
|---|---|
| James F. Sowell | Mayor |
| James T. Peterson | Vice Chairman, Council Member Seat 1 |
| Tom Larrive | Council Member Seat 2 |
| Robert F. Greenlund | Council Member Seat 3 |
| Samuel G.S. Bennett | Chairman, Council Member Seat 4 |
| Herbert J. Bennett | Council Member Seat 5 |
Population statistics
| Total | 1,736 | 100.00% |
| Under 5 years | 175 | 10.10% |
| 5 to 9 years | 158 | 9.10% |
| 10 to 14 years | 141 | 8.10% |
| 15 to 19 years | 152 | 8.80% |
| 20 to 24 years | 109 | 6.30% |
| 25 to 29 years | 115 | 6.60% |
| 30 to 34 years | 116 | 6.70% |
| 35 to 39 years | 123 | 7.10% |
| 40 to 44 years | 90 | 5.20% |
| 45 to 49 years | 94 | 5.40% |
| 50 to 54 years | 120 | 6.90% |
| 55 to 59 years | 87 | 5.00% |
| 60 to 64 years | 79 | 4.60% |
| 65 to 69 years | 68 | 3.90% |
| 70 to 74 years | 40 | 2.30% |
| 75 to 79 years | 30 | 1.70% |
| 80 to 84 years | 23 | 1.30% |
| 85 years and over | 16 | 0.90% |
| Median age (years) | 30.7 | ( X ) |
| 16 years and over | 1,229 | 70.80% |
| 18 years and over | 1,164 | 67.10% |
| 21 years and over | 1,086 | 62.60% |
| 62 years and over | 230 | 13.20% |
| 65 years and over | 177 | 10.20% |
| Male population of PIERSON, FL | 919 | 52.90% |
| Under 5 years | 84 | 4.80% |
| 5 to 9 years | 84 | 4.80% |
| 10 to 14 years | 81 | 4.70% |
| 15 to 19 years | 86 | 5.00% |
| 20 to 24 years | 57 | 3.30% |
| 25 to 29 years | 72 | 4.10% |
| 30 to 34 years | 60 | 3.50% |
| 35 to 39 years | 63 | 3.60% |
| 40 to 44 years | 46 | 2.60% |
| 45 to 49 years | 41 | 2.40% |
| 50 to 54 years | 76 | 4.40% |
| 55 to 59 years | 45 | 2.60% |
| 60 to 64 years | 42 | 2.40% |
| 65 to 69 years | 30 | 1.70% |
| 70 to 74 years | 22 | 1.30% |
| 75 to 79 years | 15 | 0.90% |
| 80 to 84 years | 9 | 0.50% |
| 85 years and over | 6 | 0.30% |
| Median age (years) | 29.7 | ( X ) |
| 16 years and over | 649 | 37.40% |
| 18 years and over | 612 | 35.30% |
| 21 years and over | 574 | 33.10% |
| 62 years and over | 109 | 6.30% |
| 65 years and over | 82 | 4.70% |
| Female population of PIERSON, FL | 817 | 47.10% |
| Under 5 years | 91 | 5.20% |
| 5 to 9 years | 74 | 4.30% |
| 10 to 14 years | 60 | 3.50% |
| 15 to 19 years | 66 | 3.80% |
| 20 to 24 years | 52 | 3.00% |
| 25 to 29 years | 43 | 2.50% |
| 30 to 34 years | 56 | 3.20% |
| 35 to 39 years | 60 | 3.50% |
| 40 to 44 years | 44 | 2.50% |
| 45 to 49 years | 53 | 3.10% |
| 50 to 54 years | 44 | 2.50% |
| 55 to 59 years | 42 | 2.40% |
| 60 to 64 years | 37 | 2.10% |
| 65 to 69 years | 38 | 2.20% |
| 70 to 74 years | 18 | 1.00% |
| 75 to 79 years | 15 | 0.90% |
| 80 to 84 years | 14 | 0.80% |
| 85 years and over | 10 | 0.60% |
| Median age (years) | 32.3 | ( X ) |
| 16 years and over | 580 | 33.40% |
| 18 years and over | 552 | 31.80% |
| 21 years and over | 512 | 29.50% |
| 62 years and over | 121 | 7.00% |
| 65 years and over | 95 | 5.50% |
| What is the Population of PIERSON, FL | 1,736 | 100.00% |
| One Race | 1,702 | 98.00% |
| White | 998 | 57.50% |
| Black or African American | 83 | 4.80% |
| American Indian and Alaska Native | 6 | 0.30% |
| Asian | 8 | 0.50% |
| Asian Indian | 0 | 0.00% |
| Chinese | 0 | 0.00% |
| Filipino | 1 | 0.10% |
| Japanese | 1 | 0.10% |
| Korean | 3 | 0.20% |
| Vietnamese | 3 | 0.20% |
| Other Asian | 0 | 0.00% |
| Native Hawaiian and Other Pacific Islander | 0 | 0.00% |
| Native Hawaiian | 0 | 0.00% |
| Guamanian or Chamorro | 0 | 0.00% |
| Samoan | 0 | 0.00% |
| Other Pacific Islander | 0 | 0.00% |
| Hispanic | 607 | 35.00% |
| Two or More Races | 34 | 2.00% |
| White; American Indian and Alaska Native | 4 | 0.20% |
| White; Asian | 1 | 0.10% |
| White; Black or African American | 5 | 0.30% |
| White; Some Other Race | 11 | 0.60% |
| Race alone or in combination with one or more other races: | ||
| White | 1,019 | 58.70% |
| Black or African American | 97 | 5.60% |
| American Indian and Alaska Native | 13 | 0.70% |
| Asian | 13 | 0.70% |
| Native Hawaiian and Other Pacific Islander | 0 | 0.00% |
| Some Other Race | 628 | 36.20% |
| HISPANIC OR LATINO POPULATION FOR PIERSON, FL | ||
| Total population | 1,736 | 100.00% |
| Hispanic or Latino (of any race) | 940 | 54.10% |
| Mexican | 910 | 52.40% |
| Puerto Rican | 8 | 0.50% |
| Cuban | 7 | 0.40% |
| Other Hispanic or Latino | 15 | 0.90% |
| Not Hispanic or Latino | 796 | 45.90% |
| HISPANIC OR LATINO AND RACE | ||
| Total population | 1,736 | 100.00% |
| Hispanic or Latino | 940 | 54.10% |
| White alone | 305 | 17.60% |
| Black or African American alone | 3 | 0.20% |
| American Indian and Alaska Native alone | 0 | 0.00% |
| Asian alone | 2 | 0.10% |
| Native Hawaiian and Other Pacific Islander alone | 0 | 0.00% |
| Some Other Race alone | 606 | 34.90% |
| Two or More Races | 24 | 1.40% |
| Not Hispanic or Latino | 796 | 45.90% |
| White alone | 693 | 39.90% |
| Black or African American alone | 80 | 4.60% |
| American Indian and Alaska Native alone | 6 | 0.30% |
| Asian alone | 6 | 0.30% |
| Native Hawaiian and Other Pacific Islander alone | 0 | 0.00% |
| Some Other Race alone | 1 | 0.10% |
| Two or More Races | 10 | 0.60% |
| The Population of PIERSON, FL | 1,736 | 100.00% | |
| In households | 1,674 | 96.40% | |
| Householder | 486 | 28.00% | |
| Spouse | 291 | 16.80% | |
| Child | 610 | 35.10% | |
| Own child under 18 years | 440 | 25.30% | |
| Other relatives | 168 | 9.70% | |
| Under 18 years | 84 | 4.80% | |
| 65 years and over | 14 | 0.80% | |
| Nonrelatives | 119 | 6.90% | |
| Under 18 years | 20 | 1.20% | |
| 65 years and over | 3 | 0.20% | |
| Unmarried partner | 46 | 2.60% | |
| In group quarters | 62 | 3.60% | |
| Institutionalized population | 0 | 0.00% | |
| Male | 0 | 0.00% | |
| Female | 0 | 0.00% | |
| Noninstitutionalized population | 62 | 3.60% | |
| Male | 33 | 1.90% | |
| Female | 29 | 1.70% |
| Total households for PIERSON, FL | 486 | 100.00% |
| Family households (families) | 381 | 78.40% |
| With own children under 18 years | 194 | 39.90% |
| Husband-wife family | 291 | 59.90% |
| With own children under 18 years | 141 | 29.00% |
| Male householder, no wife present | 34 | 7.00% |
| With own children under 18 years | 21 | 4.30% |
| Female householder, no husband present | 56 | 11.50% |
| With own children under 18 years | 32 | 6.60% |
| Nonfamily households | 105 | 21.60% |
| Householder living alone | 73 | 15.00% |
| Male | 36 | 7.40% |
| 65 years and over | 8 | 1.60% |
| Female | 37 | 7.60% |
| 65 years and over | 28 | 5.80% |
| Households with individuals under 18 years | 229 | 47.10% |
| Households with individuals 65 years and over | 132 | 27.20% |
| Average household size of PIERSON, FL | 3.44 | ( X ) |
| Average family size for PIERSON, FL | 3.81 | ( X ) |
| Total housing units | 540 | 100.00% | |
| Occupied housing units | 486 | 90.00% | |
| Vacant housing units | 54 | 10.00% | |
| For rent | 11 | 2.00% | |
| Rented, not occupied | 0 | 0.00% | |
| For sale only | 10 | 1.90% | |
| Sold, not occupied | 3 | 0.60% | |
| For seasonal, recreational, or occasional use | 2 | 0.40% | |
| All other vacants | 28 | 5.20% | |
| Homeowner vacancy rate (percent) | 2.9 | ( X ) | |
| Rental vacancy rate (percent) | 6.8 | ( X ) |
| Occupied housing units | 486 | 100.00% |
| Owner-occupied housing units | 336 | 69.10% |
| Population in owner-occupied housing units | 1,071 | ( X ) |
| Average household size of owner-occupied units | 3.19 | ( X ) |
| Renter-occupied housing units | 150 | 30.90% |
| Population in renter-occupied housing units | 603 | ( X ) |
| Average household size of renter-occupied units | 4.02 | ( X ) |
References
- "2019 U.S. Gazetteer Files". United States Census Bureau. Retrieved July 2, 2020.
- "Population and Housing Unit Estimates". United States Census Bureau. May 24, 2020. Retrieved May 27, 2020.
- "U.S. Census website". United States Census Bureau. Retrieved 2008-01-31.
- "US Board on Geographic Names". United States Geological Survey. 2007-10-25. Retrieved 2008-01-31.
- "Profile of General Population and Housing Characteristics: 2010 Demographic Profile Data (DP-1): Pierson town, Florida". United States Census Bureau. Retrieved February 16, 2012.
- Timm, Jane C (April 22, 2018). "Trump-voting Florida county is a lot like sanctuary cities he loathes". NBC News. Retrieved 2018-04-24.
- "US Gazetteer files: 2010, 2000, and 1990". United States Census Bureau. 2011-02-12. Retrieved 2011-04-23.
- "National Baseball Hall of Fame and Museum".
- "Census of Population and Housing". Census.gov. Retrieved June 4, 2015.
- http://www.townofpierson.org/Town_Council.html
