Northern California Megaregion
The Northern California Megaregion (also Northern California Megalopolis), distinct from Northern California, is an urbanized region of California consisting of many large cities including San Francisco, San Jose, Sacramento, and Oakland. There are varying definitions of the megaregion, but it is generally seen as encompassing the San Francisco Bay Area, the Sacramento area, northern San Joaquin Valley, and the Monterey Bay Area.[1]
Northern California Megaregion | |
|---|---|
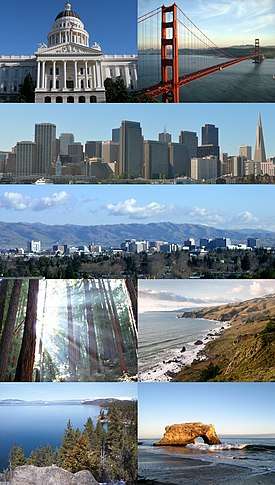
 Clockwise: California State Capitol, Golden Gate Bridge, San Francisco skyline, San Jose skyline, Muir Woods National Monument, the northern California coast from Muir Beach Overlook, view of Lake Tahoe, and Natural Bridges State Beach in Santa Cruz. | |
| State | |
| Largest Cities |
|
| Area | |
| • Land | 60,010 km2 (23,171 sq mi) |
| Population (2017) | |
| • Total | 12,594,831 |
| • Density | 209.9/km2 (543.6/sq mi) |
The most common definition of the megaregion consists of the San Jose–San Francisco–Oakland Combined Statistical Area, the Sacramento-Roseville-Arden-Arcade Metropolitan Statistical Area, the Yuba City Metropolitan Statistical Area, the Modesto-Merced Combined Statistical Area, and the Salinas Metropolitan Area.[2][3][4] Under this definition, the megaregion was home to 12.6 million residents in 2018,[5] and had a GDP of $1.21 trillion,[6] resulting in a GDP per capita of $96,029. The megaregion thus accounted for 3.9% of the U.S. population,[5] and 5.9% of the U.S. economy in 2018.[7]
The concept is seen as increasingly relevant in the context of a rapidly growing Northern California economy plagued by transportation issues and a lack of affordable housing.[8][3]
The region is home to some of the world's highest ranked universities, including Stanford University, University of California - Berkeley, University of California - San Francisco, and University of California - Davis.[9]
Concept
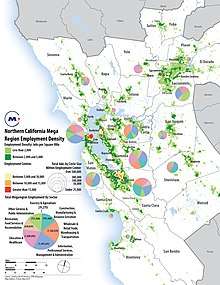
In 2005, the Regional Plan Association launched its program, America 2050, which outlined 11 Megaregions of the United States, including a "Northern California Megaregion."[10] This proposed region extended from Monterey to Sonoma County and from Fresno to Reno, Nevada. In 2007, the San Francisco Bay Area Planning and Urban Research Association (SPUR), published a report detailing a more restrictive definition of the Megaregion, which included the counties and metropolitan areas highlighted in the map below.[2][11] In 2016, the Bay Area Council's Economic Institute published a report titled, "The Northern California Megaregion," using the same delineation for the region as the SPUR report.[3] The report listed the megaregion as being the fifth most populous U.S. megaregion, as having the highest Gross Regional Product per capita of any U.S. megaregion, and as making up over 5% of the U.S. economy. The report also stated that as of 2013, 188 thousand commuters crossed between the subregions of the megaregion daily, including 132 thousand moving from the outer subregions into the Bay Area daily.
The Capitol Corridor Joint Powers Authority has integrated the concept into their "Vision Plan" to increase connectedness between the Bay Area and Sacramento Area.[12]
The Metropolitan Transportation Commission (MTC) has used the concept in several programs and analyses, including their "Northern California Mega-Region Goods Movement Study," a partnership between the MTC, the Sacramento Area Council of Governments, the Association of Monterey Bay Area Governments, the San Joaquin Council of Governments, and Caltrans.[13]
Infrastructure and Transportation
The megaregion's transportation network consists of a number of highways, passenger rail lines, bus services, and ferry lines.[3]
The region's passenger rail service includes:
- Altamont Corridor Express, connecting San Jose, the Tri-Valley, and San Joaquin County
- Amtrak's Capitol Corridor and San Joaquins lines, connecting the Bay Area with Sacramento and the San Joaquin Valley, in addition to the California Zephyr and Coast Starlight long distance inter-city rail services
- Bay Area Rapid Transit (BART), which will soon connect the Bay Area's five most populous counties
- Caltrain, connecting San Francisco to the Peninsula and Silicon Valley
- Sacramento Regional Transit, light rail and bus transit service in Sacramento and surrounding areas
- Muni Metro, light rail in San Francisco
- SMART, connecting Sonoma and Marin counties
- VTA light rail, light rail in Santa Clara County
California High-Speed Rail, projected to be completed sometime beyond 2033, will tie the region closer together, and also connect it with the Southern California Megaregion.[14]
Metropolitan Areas

| Metropolitan Statistical Area | Population 2018[5] | GDP 2018[6] | GDP per capita 2018 |
|---|---|---|---|
| San Francisco–Oakland–Berkeley, CA MSA | 4,729,484 | $548.6 billion | $115,999 |
| Sacramento-Roseville-Folsom, CA MSA | 2,345,210 | $145.5 billion | $62,033 |
| San Jose-Sunnyvale-Santa Clara, CA MSA | 1,999,107 | $331.0 billion | $165,584 |
| Stockton, CA MSA | 752,660 | $32.3 billion | $42,952 |
| Modesto, CA MSA | 549,815 | $25.1 billion | $45,713 |
| Santa Rosa-Petaluma, CA MSA | 499,942 | $32.0 billion | $63,927 |
| Vallejo, CA MSA | 446,610 | $26.4 billion | $59,203 |
| Salinas, CA MSA | 435,594 | $27.4 billion | $62,956 |
| Santa Cruz-Watsonville, CA MSA | 274,255 | $15.3 billion | $55,825 |
| Merced, CA MSA | 274,765 | $9.8 billion | $35,665 |
| Yuba City, CA MSA | 174,848 | $7.2 billion | $41,310 |
| Napa, CA MSA | 139,417 | $11.3 billion | $81,173 |
| Northern California Megaregion | 12,621,707 | $1,212.0 billion | $96,029 |
Subregions
| Subregion | Counties | MPOs [15] | Population 2018[5] | GDP 2018[16][17] | GDP per capita 2018 | Population Projection 2050[18] |
|---|---|---|---|---|---|---|
| San Francisco Bay Area | San Francisco, San Mateo, Santa Clara, Alameda, Contra Costa, Marin, Sonoma, Napa, Solano | MTC | 7,753,023 | $946.6 billion | $122,093 | 9,112,910 |
| Sacramento Area | Sacramento, Placer, El Dorado, Yolo, Yuba, Sutter | SACOG | 2,520,058 | $152.7 billion | $60,595 | 3,165,485 |
| Northern San Joaquin Valley | San Joaquin, Stanislaus, Merced | SJCOG, StanCOG, MCAG | 1,577,240 | $67.3 billion | $42,645 | 2,135,006 |
| Monterey Bay Area | Monterey, Santa Cruz, San Benito | AMBAG | 771,386 | $45.5 billion | $58,975 | 862,076 |
| Northern California Megaregion | 12,621,707 | $1,212.0 billion | $96,029 | 15,275,477 |
See also
| Wikimedia Commons has media related to Northern California Megaregion. |
References
- "New Report: As Northern California Megaregion Takes Shape, Megaproblems Intensify". Bay Area Council. 2016-06-30. Retrieved 2019-02-01.
- "SPUR: The Northern California Megaregion" (PDF). SPUR.
- "The Northern California Megaregion | Bay Area Council Economic Institute". Retrieved 2019-02-01.
- "Where Exactly Is "the Bay Area"?". SPUR. 2018-06-18. Retrieved 2019-02-01.
- Bureau, US Census. "Population and Housing Unit Estimates". www.census.gov. Retrieved 2019-02-01.
- "GDP by Metropolitan Area | U.S. Bureau of Economic Analysis (BEA)". www.bea.gov. Retrieved 2019-02-01.
- "Gross Domestic Product | U.S. Bureau of Economic Analysis (BEA)". www.bea.gov. Retrieved 2019-02-01.
- "Megaregion a vision for redistributing the California dream - SFChronicle.com". www.sfchronicle.com. 2018-07-27. Retrieved 2019-02-01.
- "Best Global Universities Rankings". US News.
- "Northern California - America 2050". www.america2050.org. Retrieved 2019-02-01.
- "The Northern California Megaregion – Definitions and Challenges - America 2050". www.america2050.org. Retrieved 2019-02-01.
- "CCJPA Vision Plan, What the Capitol Corridor Can Become". Capitol Corridor. Retrieved 2019-02-01.
- "Northern California Mega-Region Goods Movement Study | Plans + Projects | Our Work | Metropolitan Transportation Commission". mtc.ca.gov. Retrieved 2019-02-01.
- "High-Speed Rail: Northern California at a Glance" (PDF).
- "California Metropolitan Planning Organizations (MPOs) and Regional Transportation Planning Agencies (RTPAs)" (PDF).
- "GDP by County | U.S. Bureau of Economic Analysis (BEA)". www.bea.gov. Retrieved 2019-02-01.
- U.S. Bureau of Labor Statistics (1984-01-01). "Consumer Price Index for All Urban Consumers: All items less food and energy". FRED, Federal Reserve Bank of St. Louis. Retrieved 2019-02-01.
- "Demographic Projections". www.dof.ca.gov. Retrieved 2019-02-01.