North Carolina's 13th congressional district
The thirteenth congressional district of North Carolina was re-established in 2002 after the state gained population in the 2000 United States Census. Previously, the state had 13 districts from the first election following the 1810 United States Census until the reapportionment following the 1840 United States Census.
| North Carolina's 13th congressional district | |||
|---|---|---|---|
.tif.png) North Carolina's 13th congressional district since January 3, 2017 | |||
| Representative |
| ||
| Distribution |
| ||
| Population (2016) | 768,213[2] | ||
| Median income | $50,803[2] | ||
| Ethnicity |
| ||
| Cook PVI | R+6[3] | ||
From 2003 to 2013 the district included most of northern Wake County, all of Person and Caswell counties as well as parts of Rockingham, Granville, Guilford, and Alamance counties.
However, reapportionment after the 2010 census shifted the district more to the south and east. As a result, it lost its share of Alamance, Caswell, Guilford, Person, and Rockingham counties. In place of those five counties, portions of Durham, Edgecombe, Franklin, Nash, Vance, Wayne, and Wilson counties were added. More of Wake County and less of Granville County were also included. While Barack Obama carried the old 13th with 59 percent of the vote in 2008, John McCain would have won it with 54 percent of the vote had it existed under the new lines.
As a result, Congressman Brad Miller (Democrat), who represented the district from its creation in 2003, announced he would not seek re-election to office in 2012.[4][5] From 2013 to 2017, the district was represented by Republican George Holding.
After a mid-decade redistricting, most of the old 13th was essentially merged with the old 2nd district. A new 13th was created, stretching from the northern suburbs of Charlotte to Greensboro. Republican Ted Budd became the first congressman from this new district.
Counties covered
The entirety of:
Parts of:
Recent election results from presidential races
| Year | Office | Results |
|---|---|---|
| 2000 | President | Bush 50 - 49% |
| 2004 | President | Kerry 52 - 47% |
| 2008 | President | Obama 59 - 40% |
| 2012 | President | Romney 56 - 42% |
| 2016 | President | Trump 53 - 44% |
List of members representing the district
| Member | Party | Term | Cong ress |
Electoral history | District location |
|---|---|---|---|---|---|
| District created March 4, 1813 | |||||
| Meshack Franklin | Democratic-Republican | March 4, 1813 – March 3, 1815 |
13th | Redistricted from the 12th district and re-elected in 1813. Lost re-election. |
1813–1823 [data unknown/missing] |
| Lewis Williams | Democratic-Republican | March 4, 1815 – March 3, 1823 |
14th 15th 16th 17th 18th 19th 20th 21st 22nd 23rd 24th 25th 26th 27th |
Elected in 1815. Re-elected in 1817. Re-elected in 1819. Re-elected in 1821. Re-elected in 1823. Re-elected in 1823. Re-elected in 1825. Re-elected in 1827. Re-elected in 1829. Died. | |
| Crawford Democratic-Republican | March 4, 1823 – March 3, 1825 |
1823–1833 [data unknown/missing] | |||
| Anti-Jacksonian | March 4, 1825 – March 3, 1837 | ||||
| 1833–1843 [data unknown/missing] | |||||
| Whig | March 4, 1837 – February 23, 1842 | ||||
| Vacant | February 23, 1842 – April 27, 1842 | ||||
| Anderson Mitchell | Whig | April 27, 1842 – March 3, 1843 |
27th | Elected to finish Williams's term. Redistricted to the 3rd district and lost re-election. | |
| District inactive | March 4, 1843 – January 3, 2003 | ||||
 Brad Miller |
Democratic | January 3, 2003 – January 3, 2013 |
108th 109th 110th 111th 112th |
Elected in 2002. Re-elected in 2004. Re-elected in 2006. Re-elected in 2008. Re-elected in 2010. Retired. |
2003–2013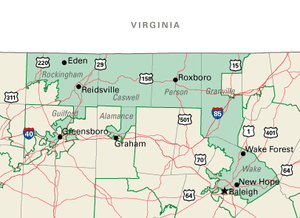 |
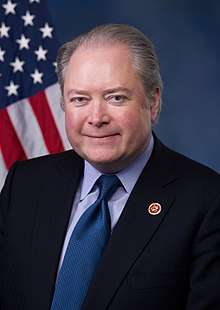 George Holding |
Republican | January 3, 2013 – January 3, 2017 |
113th 114th |
Elected in 2012. Re-elected in 2014. Redistricted to the 2nd district. |
2013–2017.tif.png) |
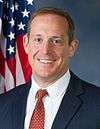 Ted Budd |
Republican | January 3, 2017 – Present |
115th 116th |
Elected in 2016. Re-elected in 2018. |
2017–Present.tif.png) |
Election results
| Year | Democratic | Republican | Libertarian |
|---|---|---|---|
| 2002 | Brad Miller: 100,287 | Carolyn W. Grant: 77,688 | Alex MacDonald: 5,295 |
| 2004 | Brad Miller: 160,896 | Virginia Johnson: 112,788 | |
| 2006 | Brad Miller: 98,540 | Vernon Robinson: 56,120 | |
| 2008 | Brad Miller: 221,379 | Hugh Webster: 114,383 | |
| 2010 | Brad Miller: 116,103 | William Randall: 93,099 | |
| 2012 | Charles Malone: 160,115 | George Holding: 210,495 |
References
- https://www.census.gov/geo/maps-data/data/cd_state.html
- Center for New Media & Promotion (CNMP), US Census Bureau. "My Congressional District". www.census.gov.
- "Partisan Voting Index – Districts of the 115th Congress" (PDF). The Cook Political Report. April 7, 2017. Retrieved April 7, 2017.
- "Redistricting sets up Miller, Price as 4th district rivals". News & Observer. Retrieved August 13, 2012.
- "Rep. Miller won't fight Rep. Price for 4th district seat". News & Observer. Retrieved August 13, 2012.
- Martis, Kenneth C. (1989). The Historical Atlas of Political Parties in the United States Congress. New York: Macmillan Publishing Company.
- Martis, Kenneth C. (1982). The Historical Atlas of United States Congressional Districts. New York: Macmillan Publishing Company.
- Congressional Biographical Directory of the United States 1774–present