New Mexico's 1st congressional district
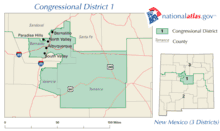
New Mexico's 1st congressional district of the United States House of Representatives serves the central area of New Mexico, including most of Bernalillo County, all of Torrance County, and parts of Sandoval, Santa Fe and Valencia counties. It includes almost three-fourths of Albuquerque. The district has a notable Native American presence, encompassing several pueblos including the Pueblo of Laguna and Sandia Pueblo outside Albuquerque.[4] The seat is currently occupied by Democrat Deb Haaland, who was first elected in 2018. She succeeded Michelle Lujan Grisham, who retired after becoming Governor of New Mexico.
| New Mexico's 1st congressional district | |||
|---|---|---|---|
.tif.png) New Mexico's 1st congressional district - since January 3, 2013. | |||
| Representative |
| ||
| Distribution |
| ||
| Population (2015) | 690,571[1] | ||
| Median income | $50,159[2] | ||
| Ethnicity |
| ||
| Cook PVI | D+7[3] | ||
History
Until the 1968 elections, New Mexico's representatives were all elected at-large statewide. Starting in 1969, however, they were elected by districts. (See New Mexico's At-large congressional district.)
Voting
Election results from presidential races[5][6]
| Year | Office | Result |
|---|---|---|
| 2000 | President | Gore 48 - 47% |
| 2004 | President | Kerry 51 - 48% |
| 2008 | President | Obama 60 - 40% |
| 2012 | President | Obama 55 - 40% |
| 2016 | President | Clinton 52 - 35% |
| 2018 | Senate | Heinrich 52 - 35% |
| 2018 | Governor | Lujan Grisham 61 - 39% |
List of members representing the district
District created January 3, 1969.
| Member | District Home | Party | Years | Cong ress |
Electoral history |
|---|---|---|---|---|---|
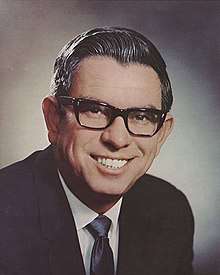 Manuel Lujan |
Albuquerque | Republican | January 3, 1969 – January 3, 1989 |
91st 92nd 93rd 94th 95th 96th 97th 98th 99th 100th |
Elected in 1968. Re-elected in 1970. Re-elected in 1972. Re-elected in 1974. Re-elected in 1976. Re-elected in 1978. Re-elected in 1980. Re-elected in 1982. Re-elected in 1984. Re-elected in 1986. Retired and then was appointed to U.S. Secretary of the Interior. |
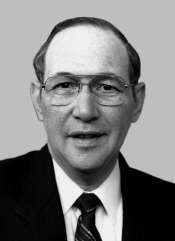 Steven Schiff |
Albuquerque | Republican | January 3, 1989 – March 25, 1998 |
101st 102nd 103rd 104th 105th |
Elected in 1988. Re-elected in 1990. Re-elected in 1992. Re-elected in 1994. Re-elected in 1996. Died. |
| Vacant | March 25, 1998 – June 25, 1998 |
105th | |||
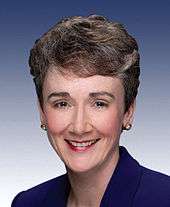 Heather Wilson |
Albuquerque | Republican | June 25, 1998 – January 3, 2009 |
105th 106th 107th 108th 109th 110th |
Elected to finish Schiff's term. Re-elected in November 1998. Re-elected in 2000. Re-elected in 2002. Re-elected in 2004. Re-elected in 2006. Retired to run for U.S. Senator. |
 Martin Heinrich |
Albuquerque | Democratic | January 3, 2009 – January 3, 2013 |
111th 112th |
Elected in 2008. Re-elected in 2010. Retired to run for U.S. Senator. |
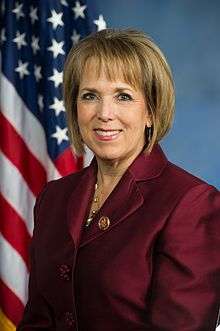 Michelle Lujan Grisham |
Albuquerque | Democratic | January 3, 2013 – December 31, 2018 |
113th 114th 115th |
Elected in 2012. Re-elected in 2014. Re-elected in 2016. Resigned when elected Governor of New Mexico.[7] |
| Vacant | December 31, 2018 – January 3, 2019 |
115th | |||
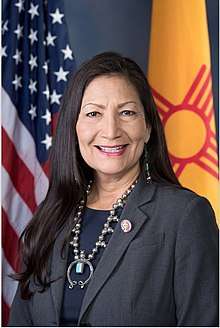 Deb Haaland |
Albuquerque | Democratic | January 3, 2019 – present |
116th | Elected in 2018. |
Election results
|
1968 • 1970 • 1972 • 1974 • 1976 • 1978 • 1980 • 1982 • 1984 • 1986 • 1988 • 1990 • 1992 • 1994 • 1996 • 1998 (Special) • 1998 • 2000 • 2002 • 2004 • 2006 • 2008 • 2010 • 2012 • 2014 • 2016 • 2018 |
1968
| Party | Candidate | Votes | % | ||
|---|---|---|---|---|---|
| Republican | Manuel Lujan | 88,517 | 52.85 | ||
| Democratic | Thomas G. Morris | 78,117 | 46.64 | ||
| Independent | William Higgs | 854 | 0.51 | ||
| Total votes | 167,488 | 100.0 | |||
| Republican win (new seat) | |||||
1970
| Party | Candidate | Votes | % | |
|---|---|---|---|---|
| Republican | Manuel Lujan (incumbent) | 91,187 | 58.53 | |
| Democratic | Fabian Chavez, Jr. | 64,598 | 41.47 | |
| Total votes | 155,785 | 100.0 | ||
| Republican hold | ||||
1972
| Party | Candidate | Votes | % | |
|---|---|---|---|---|
| Republican | Manuel Lujan (incumbent) | 118,403 | 55.68 | |
| Democratic | Eugene Gallegos | 94,239 | 44.32 | |
| Total votes | 212,642 | 100.0 | ||
| Republican hold | ||||
1974
| Party | Candidate | Votes | % | |
|---|---|---|---|---|
| Republican | Manuel Lujan (incumbent) | 106,268 | 58.61 | |
| Democratic | Roberto Mondragón | 71,968 | 39.69 | |
| American Independent | Martin Molloy | 3,069 | 1.70 | |
| Total votes | 181,305 | 100.0 | ||
| Republican hold | ||||
1976
| Party | Candidate | Votes | % | |
|---|---|---|---|---|
| Republican | Manuel Lujan (incumbent) | 162,587 | 72.09 | |
| Democratic | Raymond Garcia | 61,800 | 27.40 | |
| Raza Unida | Jesus Aragom | 1,159 | 0.51 | |
| Total votes | 225,546 | 100.0 | ||
| Republican hold | ||||
1978
| Party | Candidate | Votes | % | |
|---|---|---|---|---|
| Republican | Manuel Lujan (incumbent) | 118,075 | 62.53 | |
| Democratic | Robert M. Hawk | 70,761 | 37.47 | |
| Total votes | 188,836 | 100.0 | ||
| Republican hold | ||||
1980
| Party | Candidate | Votes | % | |
|---|---|---|---|---|
| Republican | Manuel Lujan (incumbent) | 125,910 | 51.01 | |
| Democratic | Bill Richardson | 120,903 | 48.99 | |
| Total votes | 246,813 | 100.0 | ||
| Republican hold | ||||
1982
| Party | Candidate | Votes | % | |
|---|---|---|---|---|
| Republican | Manuel Lujan (incumbent) | 74,459 | 52.44 | |
| Democratic | Jan A. Hartke | 67,534 | 47.56 | |
| Total votes | 141,993 | 100.0 | ||
| Republican hold | ||||
1984
| Party | Candidate | Votes | % | |
|---|---|---|---|---|
| Republican | Manuel Lujan (incumbent) | 115,808 | 64.94 | |
| Democratic | Charles Ted Asbury | 60,598 | 33.98 | |
| Libertarian | Stephen P. Curtis | 1,936 | 1.08 | |
| Total votes | 178,342 | 100.0 | ||
| Republican hold | ||||
1986
| Party | Candidate | Votes | % | |
|---|---|---|---|---|
| Republican | Manuel Lujan (incumbent) | 90,476 | 70.89 | |
| Democratic | Manny Garcia | 37,138 | 29.10 | |
| Write-in | 18 | 0.01 | ||
| Total votes | 127,632 | 100.0 | ||
| Republican hold | ||||
1988
| Party | Candidate | Votes | % | |
|---|---|---|---|---|
| Republican | Steven Schiff | 89,985 | 50.56 | |
| Democratic | Tom Udall | 84,138 | 47.28 | |
| Libertarian | Allen Montgomery Parkman | 3,839 | 2.16 | |
| Total votes | 177,962 | 100.0 | ||
| Republican hold | ||||
1990
| Party | Candidate | Votes | % | |
|---|---|---|---|---|
| Republican | Steven Schiff (incumbent) | 97,375 | 70.22 | |
| Democratic | Rebecca Vigil-Giron | 41,306 | 29.78 | |
| Total votes | 138,681 | 100.0 | ||
| Republican hold | ||||
1992
| Party | Candidate | Votes | % | |
|---|---|---|---|---|
| Republican | Steven Schiff (incumbent) | 128,426 | 62.58 | |
| Democratic | Robert J. Aragon | 76,600 | 37.33 | |
| Write-in | 188 | 0.09 | ||
| Total votes | 205,214 | 100.0 | ||
| Republican hold | ||||
1994
| Party | Candidate | Votes | % | |
|---|---|---|---|---|
| Republican | Steven Schiff (incumbent) | 119,996 | 73.93 | |
| Democratic | Peter L. Zollinger | 42,316 | 26.07 | |
| Total votes | 162,312 | 100.0 | ||
| Republican hold | ||||
1996
| Party | Candidate | Votes | % | |
|---|---|---|---|---|
| Republican | Steven Schiff (incumbent) | 109,290 | 56.60 | |
| Democratic | John Wertheim | 71,635 | 37.10 | |
| Green | John A. Uhrich | 7,694 | 3.98 | |
| Independent | Betty Turrietta-Koury | 4,459 | 2.32 | |
| Total votes | 193,078 | 100.0 | ||
| Republican hold | ||||
1998 (Special)
| Party | Candidate | Votes | % | |
|---|---|---|---|---|
| Republican | Heather Wilson | 54,853 | 44.58 | |
| Democratic | Phillip Maloof | 48,747 | 39.62 | |
| Green | Robert Anderson | 18,108 | 14.72 | |
| Libertarian | Bruce Bush | 1,337 | 1.09 | |
| Total votes | 123,045 | 100.0 | ||
| Republican hold | ||||
1998
| Party | Candidate | Votes | % | |
|---|---|---|---|---|
| Republican | Heather Wilson (incumbent) | 86,784 | 48.44 | |
| Democratic | Phillip Maloof | 75,040 | 41.88 | |
| Green | Robert Anderson | 17,266 | 9.64 | |
| Write-in | 78 | 0.04 | ||
| Total votes | 179,168 | 100.0 | ||
| Republican hold | ||||
2000
| Party | Candidate | Votes | % | |
|---|---|---|---|---|
| Republican | Heather Wilson (incumbent) | 107,296 | 50.34 | |
| Democratic | John J. Kelly | 92,187 | 43.25 | |
| Green | Daniel Kerlinsky | 13,656 | 6.41 | |
| Total votes | 213,139 | 100.0 | ||
| Republican hold | ||||
2002
| Party | Candidate | Votes | % | |
|---|---|---|---|---|
| Republican | Heather Wilson (incumbent) | 95,711 | 55.34 | |
| Democratic | Richard M. Romero | 77,234 | 44.66 | |
| Total votes | 172,945 | 100.0 | ||
| Republican hold | ||||
2004
| Party | Candidate | Votes | % | |
|---|---|---|---|---|
| Republican | Heather Wilson (incumbent) | 147,372 | 54.40 | |
| Democratic | Richard M. Romero | 123,339 | 45.53 | |
| Republican | Orlin G. Cole (as a write-in) | 194 | 0.07 | |
| Total votes | 270,905 | 100.0 | ||
| Republican hold | ||||
2006
| Party | Candidate | Votes | % | |
|---|---|---|---|---|
| Republican | Heather Wilson (incumbent) | 105,986 | 50.20 | |
| Democratic | Patricia A. Madrid | 105,125 | 49.80 | |
| Total votes | 211,111 | 100.0 | ||
| Republican hold | ||||
2008
2008 Primary Election
| Party | Candidate | Votes | % | |
|---|---|---|---|---|
| Democratic | Martin Heinrich | 22,344 | 43.51 | |
| Democratic | Rebecca Vigil-Giron | 12,659 | 24.65 | |
| Democratic | Michelle Lujan Grisham | 12,073 | 23.51 | |
| Democratic | Robert Pidcock | 4,272 | 8.33 | |
| Party | Candidate | Votes | % | |
|---|---|---|---|---|
| Republican | Darren White | 37,055 | 81.80 | |
| Republican | Joseph Cararro | 8,244 | 18.20 | |
2008 General Election
| Party | Candidate | Votes | % | |||
|---|---|---|---|---|---|---|
| Democratic | Martin Heinrich | 166,271 | 55.65 | |||
| Republican | Darren White | 132,485 | 44.35 | |||
| Total votes | 298,756 | 100.0 | ||||
| Democratic gain from Republican | ||||||
2010
| Party | Candidate | Votes | % | |
|---|---|---|---|---|
| Democratic | Martin Heinrich (incumbent) | 112,707 | 51.88 | |
| Republican | Jon Barela | 104,543 | 48.12 | |
| Total votes | 217,250 | 100.0 | ||
| Democratic hold | ||||
2012
| Party | Candidate | Votes | % | |
|---|---|---|---|---|
| Democratic | Michelle Lujan Grisham | 162,924 | 59.06 | |
| Republican | Janice E. Arnold-Jones | 112,473 | 40.77 | |
| Green | Jeanne Pahls (Write-In) | 459 | 0.17 | |
| Total votes | 275,856 | 100.0 | ||
2014
| Party | Candidate | Votes | % | |
|---|---|---|---|---|
| Democratic | Michelle Lujan Grisham (Incumbent) | 105,474 | 58.59 | |
| Republican | Michael Frese | 74,558 | 41.41 | |
| Total votes | 180,032 | 100 | ||
| Democratic hold | ||||
2016
| Party | Candidate | Votes | % | |
|---|---|---|---|---|
| Democratic | Michelle Lujan Grisham (Incumbent) | 181,088 | 65.15 | |
| Republican | Richard Gregory Priem | 96,879 | 34.85 | |
| Total votes | 277,967 | 100 | ||
| Democratic hold | ||||
2018
| Party | Candidate | Votes | % | |
|---|---|---|---|---|
| Democratic | Deb Haaland | 144,302 | 59.02 | |
| Republican | Janice E Arnold-Jones | 89,066 | 36.43 | |
| Libertarian | Lloyd J Princeton | 11,143 | 4.56 | |
| Total votes | 244,511 | 100.01 | ||
| Democratic hold | ||||
Historical district boundaries
Notes
- https://www.census.gov/mycd/. Missing or empty
|title=(help) - https://www.census.gov/mycd/?st=35&cd=01
- "Partisan Voting Index – Districts of the 115th Congress" (PDF). The Cook Political Report. April 7, 2017. Retrieved April 7, 2017.
- "Pueblos, Tribes & Nations". www.newmexico.org. Retrieved June 22, 2018.
- Presidential Election Results, by district, swingstateproject.com
- https://docs.google.com/spreadsheet/pub?key=0Av8O-dN2giY6dEFCOFZ4ZnlKS0x3M3Y0WHd5aWFDWkE&single=true&gid=0&output=html
- Boyd, Dan (December 13, 2016). "Lujan Grisham running for governor". Albuquerque Journal. Retrieved April 2, 2017.
- 1968 Election Results
- 1970 Election Results
- 1972 Election Results
- 1974 Election Results
- 1976 Election Results
- 1978 Election Results
- 1980 Election Results
- 1982 Election Results
- 1984 Election Results
- 1986 Election Results
- 1988 Election Results
- 1990 Election Results
- 1992 Election Results
- 1994 Election Results
- 1996 Election Results
- 1998 Special Election Results
- 1998 Election Results
- 2000 Election Results
- 2002 Election Results
- 2004 Election Results
- 2006 Election Results
- "2008 Primary Results" (PDF). Archived from the original (PDF) on 2016-10-22. Retrieved 2011-05-11.
- "2008 Primary Results" (PDF). Archived from the original (PDF) on 2016-10-22. Retrieved 2011-05-11.
- 2008 Election Results
- "2010 Election Results" (PDF). Archived from the original (PDF) on 2011-09-27. Retrieved 2011-05-11.
- "Statewide Results". New Mexico Secretary of State. Archived from the original on 2017-12-27.
- "Official Results General Election - November 4, 2014". New Mexico Secretary of State. November 4, 2014. Retrieved January 2, 2015.
- "Election Night Results - November 8, 2016". New Mexico Secretary of State. November 8, 2016. Retrieved December 7, 2016.
- "Election Night Results - November 6, 2018". New Mexico Secretary of State. November 6, 2018. Retrieved November 7, 2018.
References
- Martis, Kenneth C. (1989). The Historical Atlas of Political Parties in the United States Congress. New York: Macmillan Publishing Company.
- Martis, Kenneth C. (1982). The Historical Atlas of United States Congressional Districts. New York: Macmillan Publishing Company.
- Congressional Biographical Directory of the United States 1774–present