Mutia, Zamboanga del Norte
Mutia, officially the Municipality of Mutia (Cebuano: Lungsod sa Mutia; Subanen: Benwa Mutia; Chavacano: Municipalidad de Mutia; Tagalog: Bayan ng Mutia), is a 5th class municipality in the province of Zamboanga del Norte, Philippines. According to the 2015 census, it has a population of 12,675 people.[3]
Mutia | |
|---|---|
| Municipality of Mutia | |
 Seal | |
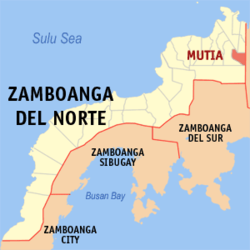
 Map of Zamboanga del Norte with Mutia highlighted | |
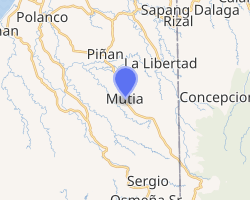
OpenStreetMap 
| |
.svg.png) Mutia Location within the Philippines | |
| Coordinates: 8°25′03″N 123°28′38″E | |
| Country | |
| Region | Zamboanga Peninsula (Region IX) |
| Province | Zamboanga del Norte |
| District | 1st District |
| Barangays | 16 (see Barangays) |
| Government | |
| • Type | Sangguniang Bayan |
| • Mayor | Lorrymir Adasa |
| • Vice Mayor | Arthur Tenorio |
| • Congressman | Romeo M. Jalosjos Jr. |
| • Electorate | 8,712 voters (2019) |
| Area | |
| • Total | 73.58 km2 (28.41 sq mi) |
| Population (2015 census)[3] | |
| • Total | 12,675 |
| • Density | 170/km2 (450/sq mi) |
| • Households | 2,683 |
| Economy | |
| • Income class | 5th municipal income class |
| • Poverty incidence | 49.99% (2015)[4] |
| • Revenue (₱) | 52,982,102.81 (2016) |
| Time zone | UTC+8 (PST) |
| ZIP code | 7107 |
| PSGC | |
| IDD : area code | +63 (0)65 |
| Climate type | tropical climate |
| Native languages | Subanon language Cebuano Chavacano Tagalog |
| Website | mutia |
Barangays
Mutia is politically subdivided into 16 barangays.
- Alvenda
- Buenasuerte
- Diland
- Diolen
- Head Tipan
- New Casul
- New Siquijor
- Newland
- Paso Rio
- Poblacion
- San Miguel
- Santo Tomas
- Tinglan
- Totongon
- Tubac
- Unidos
Climate
| Climate data for Mutia, Zamboanga del Norte | |||||||||||||
|---|---|---|---|---|---|---|---|---|---|---|---|---|---|
| Month | Jan | Feb | Mar | Apr | May | Jun | Jul | Aug | Sep | Oct | Nov | Dec | Year |
| Average high °C (°F) | 28 (82) |
28 (82) |
29 (84) |
30 (86) |
29 (84) |
29 (84) |
29 (84) |
29 (84) |
29 (84) |
28 (82) |
29 (84) |
28 (82) |
29 (84) |
| Average low °C (°F) | 22 (72) |
22 (72) |
22 (72) |
23 (73) |
24 (75) |
24 (75) |
24 (75) |
23 (73) |
23 (73) |
23 (73) |
23 (73) |
23 (73) |
23 (73) |
| Average precipitation mm (inches) | 104 (4.1) |
76 (3.0) |
92 (3.6) |
97 (3.8) |
199 (7.8) |
238 (9.4) |
195 (7.7) |
193 (7.6) |
178 (7.0) |
212 (8.3) |
171 (6.7) |
110 (4.3) |
1,865 (73.3) |
| Average rainy days | 14.7 | 12.5 | 15.8 | 17.5 | 27.6 | 28.5 | 29.0 | 27.5 | 26.9 | 27.9 | 23.5 | 18.2 | 269.6 |
| Source: Meteoblue [5] | |||||||||||||
Demographics
| Year | Pop. | ±% p.a. |
|---|---|---|
| 1970 | 6,093 | — |
| 1975 | 6,895 | +2.51% |
| 1980 | 7,976 | +2.95% |
| 1990 | 8,625 | +0.79% |
| 1995 | 8,915 | +0.62% |
| 2000 | 9,806 | +2.06% |
| 2007 | 12,078 | +2.92% |
| 2010 | 11,975 | −0.31% |
| 2015 | 12,675 | +1.09% |
| Source: Philippine Statistics Authority[3][6][7][8] | ||
gollark: Anyway, if I can somehow get my hands on a closed timelike curve, this will be much easier.
gollark: What happens if they don't, and the bot shuts down before they've all been sent?
gollark: You know, this could work with some sort of smarter text generator, and perhaps a more predictable server.
gollark: Perhaps, but the thing is that a rough "average" of all messages looks nothing like an actual message.
gollark: Unless the bot forces random users to do it on pain of a ban... hmm.
References
- "Municipality". Quezon City, Philippines: Department of the Interior and Local Government. Retrieved 31 May 2013.
- "Province: Zamboanga del Norte". PSGC Interactive. Quezon City, Philippines: Philippine Statistics Authority. Retrieved 12 November 2016.
- Census of Population (2015). "Region IX (Zamboanga Peninsula)". Total Population by Province, City, Municipality and Barangay. PSA. Retrieved 20 June 2016.
- "PSA releases the 2015 Municipal and City Level Poverty Estimates". Quezon City, Philippines. Retrieved 12 October 2019.
- "Mutia: Average Temperatures and Rainfall". Meteoblue. Retrieved 30 April 2020.
- Census of Population and Housing (2010). "Region IX (Zamboanga Peninsula)". Total Population by Province, City, Municipality and Barangay. NSO. Retrieved 29 June 2016.
- Censuses of Population (1903–2007). "Region IX (Zamboanga Peninsula)". Table 1. Population Enumerated in Various Censuses by Province/Highly Urbanized City: 1903 to 2007. NSO.
- "Province of Zamboanga del Norte". Municipality Population Data. Local Water Utilities Administration Research Division. Retrieved 17 December 2016.
External links
This article is issued from Wikipedia. The text is licensed under Creative Commons - Attribution - Sharealike. Additional terms may apply for the media files.