List of Canadian provinces and territories by life expectancy
This is a list of Canadian provinces and territories by life expectancy. Life expectancy is the average number of years of age that a group of infants born in the same year can expect to live, if maintained, from birth. The source is from the 2018 Canadian Vital Statistics Death Database [1]
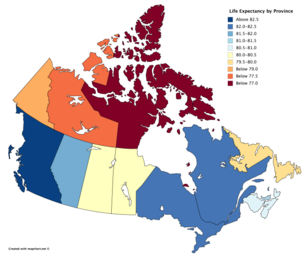
Life Expectancy in Canada in 2017
Most of the Canadian Provinces have seen rises in Life Expectancy because of medical advances in treating diseases such as Heart Disease and Cancer Newfoundland and Labrador is a notable exception as the province saw a decline in life expectancy. Although, in Nunavut large increases in life expectancy were seen due to increased rural health care
Life expectancy in 2018
| Rank | Province/Territory | Life Expectancy[1] | Life Expectancy in 2010[2] | Change 2010-2018 | Male Life Expectancy[3] | Female Life Expectancy[3] |
|---|---|---|---|---|---|---|
| 1. | 82.6 | 81.4 | 80.9 | 84.3 | ||
| 2. | 82.4 | 81.7 | 80.3 | 84.4 | ||
| 3. | 82.2 | 82.1 | 79.9 | 84.6 | ||
| - | 82.0 | 81.2 | 79.9 | 84.1 | ||
| 4. | 81.8 | 81.3 | 79.8 | 83.7 | ||
| 5. | 81.5 | 81.2 | 79.2 | 83.8 | ||
| 6. | 80.7 | 80.7 | 78.6 | 82.8 | ||
| 7. | 80.5 | 80.3 | 78.3 | 82.7 | ||
| 8. | 80.3 | 79.6 | 78.0 | 82.7 | ||
| 9. | 80.0 | 79.9 | 77.9 | 82.1 | ||
| 10. | 79.8 | 79.6 | 77.9 | 81.9 | ||
| 11. | 77.8 | 77.3 | 75.4 | 80.2 | ||
| 12. | 77.0 | 77.8 | 75.2 | 78.7 | ||
| 13. | 71.6 | 70.4 | 69.8 | 73.1 |
Past Life Expectancy
| Province/Territory | 2017[2] | 2010[2] | 2000[2] | 1990[2] | 1980[2] | Change 1980-2017 |
|---|---|---|---|---|---|---|
| 82.0 | 81.2 | 79.0 | 77.6 | 75.5 | ||
| 81.5 | 81.3 | 79.4 | 77.8 | 75.0 | ||
| 82.2 | 82.1 | 80.3 | 78.1 | 76.0 | ||
| 80.0 | 79.9 | 78.0 | 77.4 | 75.3 | ||
| 80.7 | 80.7 | 78.9 | 77.3 | 74.5 | ||
| 79.8 | 79.6 | 77.3 | 76.1 | 74.8 | ||
| 77.0 | 77.8 | 75.5 | 72.4 | 68.7 | ||
| 80.5 | 80.3 | 78.5 | 76.7 | 74.6 | ||
| 71.6 | 70.4 | 67.5 | 65.5 | 62.4 | ||
| 82.4 | 81.7 | 79.4 | 77.8 | 75.4 | ||
| 81.8 | 81.3 | 78.4 | 76.9 | 76.2 | ||
| 82.6 | 81.4 | 79.0 | 77.0 | 74.4 | ||
| 80.3 | 79.6 | 78.5 | 77.9 | 75.9 | ||
| 77.8 | 77.3 | 75.0 | 74.4 | 69.8 |
.png)
Life Expectancy in Canada 1921-2018 [4]
Discrepancies in different sources
| Province/Territory | Subnational Human
Development Index (2018)[5] |
Canadian Vital
Statistics Death Database (2017)[1] |
Statistics Canada
(2015)[6] |
OECD (2014)[7] | The Conference
Board of Canada (2011)[8] |
|---|---|---|---|---|---|
| 81.8 | 81.5 | 81.5 | 81.3 | 81.3 | |
| 82.8 | 82.2 | 82.5 | 82.3 | 82.2 | |
| 80.3 | 80.0 | 80.1 | 80.0 | 79.8 | |
| 81.0 | 80.7 | 80.9 | 80.8 | 81.1 | |
| 79.7 | 79.8 | 79.3 | 79.5 | 79.9 | |
| 77.6 | 77.0 | 77.3 | 78.2 | 77.1 | |
| 80.8 | 80.5 | 80.4 | 80.3 | 80.2 | |
| 72.6 | 71.6 | 71.9 | 71.3 | 71.8 | |
| 82.8 | 82.4 | 82.4 | 81.8 | 82.0 | |
| 81.2 | 81.8 | 82.1 | 80.5 | 80.7 | |
| 82.7 | 82.6 | 82.2 | 81.5 | 81.8 | |
| 80.5 | 80.3 | 80.1 | 79.7 | 79.7 | |
| 78.0 | 77.8 | 77.4 | 77.4 | 77.4 |
gollark: I don't routinely believe proverbs.
gollark: I… see.
gollark: They seem to be suggesting it varies between times and places.
gollark: What causes population goodness/badness then?
gollark: Well, the water-walking thing presumably has to either magically make him hover above the surface or effectively provide more contact area with the water, right?
See also
References
| Ranked | |
|---|---|
| Political |
|
| Historical | |
| Other |
|
This article is issued from Wikipedia. The text is licensed under Creative Commons - Attribution - Sharealike. Additional terms may apply for the media files.