Harrow (UK Parliament constituency)
Harrow was a constituency of the House of Commons of the UK Parliament 1885—1945 in Middlesex, a traditional county; it covered an area forming part of the north-west of today's Greater London. It returned one Member of Parliament (MP).
| Harrow | |
|---|---|
| Former County constituency for the House of Commons | |
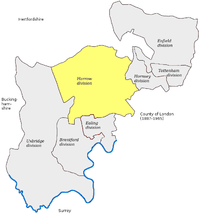 Harrow 1885-1918 | |
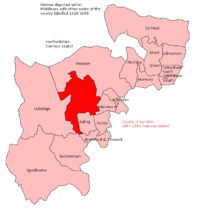 Harrow 1918-1945 | |
| 1885–1945 | |
| Number of members | one |
| Replaced by | Wembley North and Wembley South Harrow East (part of), Harrow West (part of) and Ealing West (minor contribution to) |
| Created from | Middlesex |
| During its existence contributed to new seat(s) of: | Hendon (all), Willesden West (all) and Willesden East (all) |
The constituency was created for the 1885 general election, substantially reduced on the creation of more seats in 1918 and abolished for the 1945 general election.
Boundaries
1918–1945: The Urban Districts of Harrow on the Hill, Greenford, Wealdstone, and Wembley and part of Hanwell.
Members of Parliament
| Election | Member | Party | |
|---|---|---|---|
| 1885 | William Ambrose | Conservative | |
| 1899 by-election | Irwin Cox | Conservative | |
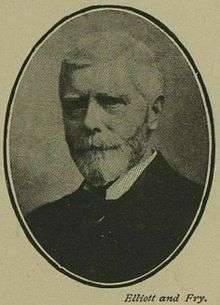
| 1906 | James Gibb | Liberal | |
| Jan. 1910 | Harry Mallaby-Deeley | Conservative | |
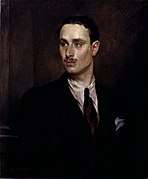
| 1918 | Oswald Mosley | Conservative | |
| 1922 | Independent | ||
| 1924 | Labour | ||
| 1924 | Sir Isidore Salmon | Conservative | |
| 1941 by-election | Norman Bower | Conservative | |
| 1945 | constituency abolished: see Harrow East and Harrow West | ||
Election results
Elections in the 1880s
| Party | Candidate | Votes | % | ± | |
|---|---|---|---|---|---|
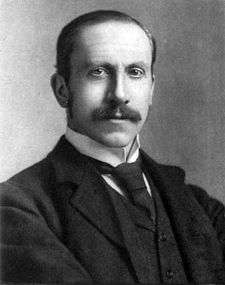
| Conservative | William Ambrose | 4,214 | 56.5 | N/A | |
| Liberal | Alfred Milner | 3,241 | 43.5 | N/A | |
| Majority | 973 | 13.0 | N/A | ||
| Turnout | 7,455 | 71.4 | N/A | ||
| Registered electors | 10,438 | ||||
| Conservative win (new seat) | |||||
| Party | Candidate | Votes | % | ± | |
|---|---|---|---|---|---|
| Conservative | William Ambrose | Unopposed | |||
| Conservative hold | |||||
Elections in the 1890s
| Party | Candidate | Votes | % | ± | |
|---|---|---|---|---|---|
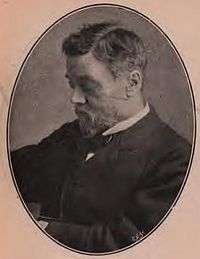
| Conservative | William Ambrose | 6,047 | 63.8 | N/A | |
| Liberal | Isaac Thomas Sadler | 3,428 | 36.2 | New | |
| Majority | 2,619 | 27.6 | N/A | ||
| Turnout | 9,475 | 67.8 | N/A | ||
| Registered electors | 13,966 | ||||
| Conservative hold | Swing | N/A | |||
| Party | Candidate | Votes | % | ± | |
|---|---|---|---|---|---|
| Conservative | William Ambrose | Unopposed | |||
| Conservative hold | |||||
Ambrose is appointed Attorney-General of the Duchy of Lancaster, requiring a by-election.
| Party | Candidate | Votes | % | ± | |
|---|---|---|---|---|---|
| Conservative | William Ambrose | Unopposed | |||
| Conservative hold | |||||
Ambrose resigned after being appointed as a Master in Lunacy, requiring a by-election.
| Party | Candidate | Votes | % | ± | |
|---|---|---|---|---|---|
| Conservative | Irwin Cox | 6,303 | 54.8 | N/A | |
| Liberal | Corrie Grant | 5,198 | 45.2 | New | |
| Majority | 1,105 | 9.6 | N/A | ||
| Turnout | 11,501 | 62.4 | N/A | ||
| Registered electors | 18,444 | ||||
| Conservative hold | Swing | N/A | |||
Elections in the 1900s
| Party | Candidate | Votes | % | ± | |
|---|---|---|---|---|---|
| Conservative | Irwin Cox | Unopposed | |||
| Conservative hold | |||||
| Party | Candidate | Votes | % | ± | |
|---|---|---|---|---|---|
| Liberal | James Gibb | 11,393 | 50.9 | N/A | |
| Liberal Unionist | William Peel | 10,977 | 49.1 | N/A | |
| Majority | 416 | 1.8 | N/A | ||
| Turnout | 22,370 | 78.1 | N/A | ||
| Registered electors | 28,627 | ||||
| Liberal gain from Conservative | Swing | N/A | |||
Elections in the 1910s
| Party | Candidate | Votes | % | ± | |
|---|---|---|---|---|---|
| Conservative | Harry Mallaby-Deeley | 16,761 | 55.3 | +6.2 | |
| Liberal | Percy Harris | 13,575 | 44.7 | -6.2 | |
| Majority | 3,186 | 10.6 | N/A | ||
| Turnout | 30,336 | 85.7 | +7.6 | ||
| Conservative gain from Liberal | Swing | +6.2 | |||
| Party | Candidate | Votes | % | ± | |
|---|---|---|---|---|---|
| Conservative | Harry Mallaby-Deeley | Unopposed | |||
| Conservative hold | |||||
General Election 1914/15:
Another General Election was required to take place before the end of 1915. The political parties had been making preparations for an election to take place and by the July 1914, the following candidates had been selected;
- Unionist: Harry Mallaby-Deeley
- Liberal: H. E. A. Cotton
| Party | Candidate | Votes | % | ± | |
|---|---|---|---|---|---|
| C | Unionist | Oswald Mosley | 13,959 | 82.3 | N/A |
| Independent | Arthur Robert Chamberlayne | 3,007 | 17.7 | New | |
| Majority | 10,934 | 64.6 | N/A | ||
| Turnout | 16,957 | 50.4 | N/A | ||
| Registered electors | 33,651 | ||||
| Unionist hold | Swing | N/A | |||
| C indicates candidate endorsed by the coalition government. | |||||
Chamberlayne was nominated by the non-party Harrow Electors League
Elections in the 1920s
| Party | Candidate | Votes | % | ± | |
|---|---|---|---|---|---|
| Independent | Oswald Mosley | 15,290 | 66.0 | New | |
| Unionist | Charles Ward-Jackson | 7,868 | 34.0 | −48.3 | |
| Majority | 7,422 | 32.0 | N/A | ||
| Turnout | 23,158 | 65.1 | +14.7 | ||
| Registered electors | 35,592 | ||||
| Independent gain from Unionist | Swing | N/A | |||
| Party | Candidate | Votes | % | ± | |
|---|---|---|---|---|---|
| Independent | Oswald Mosley | 14,079 | 59.9 | −6.1 | |
| Unionist | Edward Hugh Frederick Morris | 9,433 | 40.1 | +6.1 | |
| Majority | 4,646 | 19.8 | −12.2 | ||
| Turnout | 23,512 | 64.5 | −0.6 | ||
| Registered electors | 36,475 | ||||
| Independent hold | Swing | −6.1 | |||
| Party | Candidate | Votes | % | ± | |
|---|---|---|---|---|---|
| Unionist | Isidore Salmon | 16,526 | 54.5 | +14.4 | |
| Labour | Kenneth Lindsay | 9,507 | 31.3 | New | |
| Liberal | Sir Robert Blair | 4,320 | 14.2 | New | |
| Majority | 7,019 | 23.2 | N/A | ||
| Turnout | 30,353 | 78.5 | +14.0 | ||
| Registered electors | 38,644 | ||||
| Unionist gain from Independent | Swing | N/A | |||
| Party | Candidate | Votes | % | ± | |
|---|---|---|---|---|---|
| Unionist | Isidore Salmon | 22,466 | 42.7 | −11.8 | |
| Labour | Hubert Beaumont | 15,684 | 29.8 | −1.5 | |
| Liberal | Clement Edward Page Taylor | 12,554 | 23.8 | +9.6 | |
| Independent Unionist | WJ Sholl | 1,965 | 3.7 | New | |
| Majority | 6,782 | 12.9 | −10.3 | ||
| Turnout | 52,669 | 74.3 | −4.2 | ||
| Registered electors | 70,849 | ||||
| Unionist hold | Swing | −5.2 | |||
Elections in the 1930s
| Party | Candidate | Votes | % | ± | |
|---|---|---|---|---|---|
| Conservative | Isidore Salmon | 48,068 | 71.0 | +28.3 | |
| Labour | George Sandilands | 14,241 | 21.0 | -8.8 | |
| Liberal | Henry Cecil Banting | 5,444 | 8.0 | -15.8 | |
| Majority | 33,827 | 49.9 | +37.0 | ||
| Turnout | 67,753 | 72.1 | -2.2 | ||
| Conservative hold | Swing | +18.5 | |||
| Party | Candidate | Votes | % | ± | |
|---|---|---|---|---|---|
| Conservative | Isidore Salmon | 52,729 | 62.7 | -8.3 | |
| Labour | Helen Bentwich | 31,422 | 37.3 | +16.3 | |
| Majority | 21,307 | 25.3 | -24.6 | ||
| Turnout | 84,151 | 64.4 | -7.7 | ||
| Conservative hold | Swing | -12.3 | |||
General Election 1939/40
Another General Election was required to take place before the end of 1940. The political parties had been making preparations for an election to take place and by the Autumn of 1939, the following candidates had been selected;
- Conservative: Isidore Salmon
- Labour: Maurice S Davidson[7]
- British Union: Harry Frisby[8]
Elections in the 1940s
| Party | Candidate | Votes | % | ± | |
|---|---|---|---|---|---|
| Conservative | Norman Bower | 14,540 | 80.9 | +18.2 | |
| Ind. Democratic | Winifred Clarice Henney | 3,433 | 19.1 | New | |
| Majority | 11,107 | 61.8 | +36.5 | ||
| Turnout | 17,973 | 10.7 | -53.7 | ||
| Conservative hold | Swing | N/A | |||
References
- British Parliamentary Election Results 1885-1918, FWS Craig
- The Liberal Year Book, 1907
- Debrett's House of Commons & Judicial Bench, 1886
- Debrett's House of Commons & Judicial Bench, 1901
- Debrett's House of Commons & Judicial Bench, 1916
- British Parliamentary Election Results 1918-1949, FWS Craig
- Report of the Annual Conference of the Labour Party, 1939
- British Fascism, the Labour Movement and the State by N. Copsey, D. Renton
- Leigh Rayment's Historical List of MPs – Constituencies beginning with "H" (part 1)
- Craig, F. W. S. (1989) [1974]. British parliamentary election results 1885–1918 (2nd ed.). Chichester: Parliamentary Research Services. p. 347. ISBN 0-900178-27-2.
- Craig, F. W. S. (1983) [1969]. British parliamentary election results 1918–1949 (3rd ed.). Chichester: Parliamentary Research Services. p. 425. ISBN 0-900178-06-X.
- Skidelsky, R. (1980) [1975]. Oswald Mosley (2nd ed.). London: Macmillan Publishers Ltd. p. 75. ISBN 0333293851.
- Skidelsky, R. (1980) [1975]. Oswald Mosley (2nd ed.). London: Macmillan Publishers Ltd. p. 120. ISBN 0333293851.