European Climate Assessment and Dataset
The European Climate Assessment and Dataset (ECA&D) is a database of daily meteorological station observations across Europe and is gradually being extended to countries in the Middle East and North Africa. ECA&D has attained the status of Regional Climate Centre for high-resolution observation data in World Meteorological Organization Region VI (Europe and the Middle East)].

The objective of ECA&D is to monitor and analyze climate and changes in climate with a focus on climate extremes while making the data publicly available to download. Included in the database is a collection of daily series observations obtained from climatological divisions of National Meteorological and Hydrological Services (NMHSs), observatories and research centres throughout Europe and the Mediterranean. The daily series of observations is combined with quality control and analysis of extremes via climate change indices.[1]
The ECA&D project is initiated by the European Climate Support Network (ECSN) and is coordinated at the Royal Netherlands Meteorological Institute (Dutch: Koninklijk Nederlands Meteorologisch Instituut or KNMI) which now funds the project after it was initially funded by EUMETNET, the network of European national meteorological services.
Participants
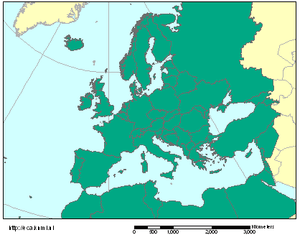
As of June 2010, the European Climate Assessment and Dataset contains 13472 series of observations at 3314 meteorological stations provided by 56 participants from 61 different countries and is constantly expanding. These participants contribute daily, quality controlled data from (a subset) of their national meteorological station networks. In order to ensure that each station's time series are as complete as possible, the database contains an automated update procedure that relies on daily data from SYNOP (surface synoptic observations) messages that are distributed in near real-time over the Global Telecommunication System (GTS). Any gaps in data are infilled with observations from nearby stations, provided they are within a 25 kilometres (16 mi) distance radius and within a height range of less than 50 metres (160 ft). These series are referred to as blended series and are used for calculating the ECA&D indices of extremes (see below) and are also used in the E–OBS daily gridded observational dataset (see below).
Participation in ECA&D is open to anyone maintaining daily station data.
Data availability
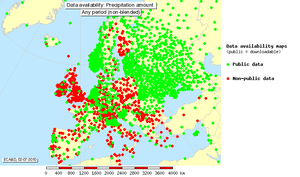
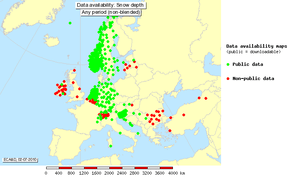
Data is available for the following elements:
- Temperature
- Mean temperature
- Maximum temperature
- Minimum temperature
- Cloud cover
- Humidity
- Precipitation amount
- Wind
- Wind speed
- Wind gust
- Wind direction
- Sunshine
- Snow depth
- Pressure
As of June 2010, the number of stations providing data involving temperature is on the order of 1500, and nearly 3000 stations contribute precipitation data. In contrast, the number of stations currently providing data for the other elements ranges from approximately 150 (wind direction) to 900 (snow depth). Data collection for the elements other than temperature and precipitation began later so the data availability is lower; however the number of stations contributing these data is rapidly increasing. In measuring these elements, nearly all countries follow the climatological practices guidelines outlined by the World Meteorological Organization. Element identification is given for all series including those provided by countries which do not follow these guidelines.
Metadata

In order to achieve the most correct interpretation of observations, metadata is collected for each station in the ECA&D database. Apart from the standard longitude, latitude and elevation, ECA&D collects other metadata as well. This includes the World Meteorological Organization station identifiers and whether or not the station is part of the Global Climate Observing System. Other examples of metadata are the land use around the observing area, soil type, surface coverage, station relocations and/or instrument changes. A photograph of the observing site may be included as well.
Indices of extremes
Using the daily data, a total of 48 indices are calculated for every ECA&D station. Each index describes a particular characteristic of climate change for both changes in the mean and changes in the extremes. A core set of 26 indices follows the definitions recommended by the Expert Team on Climate Change Detection and Indices and are calculated in similar ways as in other regions of the world. An additional set of 22 indices highlights particular characteristics of climate change in Europe.[2]
The calculated indices fall into the following categories:
- Cold
- Drought
- Heat
- Pressure
- Rain
- Snow
- Sun
- Temperature
Some indices are expressed via a fixed threshold and others are based on percentiles. Fixed threshold indices describe a particular criteria such as the number of frost days that the minimum temperature is below 0 °C, or as another example, the number of heavy precipitation days that the precipitation sum exceeds 10 millimetres (0.39 in). Percentile indices describe the case in which a value of a variable falls above a certain percentage, such as the number of days that the precipitation sum exceeds the 75th, 95th or 99th percentile.
The station series used for index calculations are blended series (see above). They are made by utilizing the most recent data from synoptical messages distributed over the Global Telecommunication System (GTS). Any gaps in data are infilled with observations from nearby stations, provided they are within a 25 kilometres (16 mi) distance radius and within a height range of less than 50 metres (160 ft). Information on the underlying series that are used in the blending process is provided for each blended series. The blended series for temperature and precipitation have also been tested for homogeneity (see below). Additional information regarding the blending process can be found in the ECA&D Algorithm Theoretical Basis Document.[2]
Quality control and homogeneity
Series of the best possible quality are provided for ECA&D by the participating institutions. However, even with careful data validation, it can never be excluded that some errors remain undetected. The risk of such errors is greatest in the recent data that stem from synoptical messages. Thus, all series in ECA&D (both non-blended and blended) are quality controlled, and all blended temperature and precipitation series are checked for inhomogeneities.
The quality control procedures lead to each data being flagged as either "OK", "suspect" or "missing" and homogeneity testing results in the classification of series as "useful", "doubtful" or "suspect". It is recommended to use the results of the homogeneity tests for selecting appropriate series and time intervals since the "useful", "doubtful" and "suspect" categories only hold for the particular time interval for which the tests are applied. Information on the specifics of quality control and homogeneity procedures can be found in the Algorithm Theoretical Basis Document [2] and elsewhere.[3]
There is, however, no well-established testing procedure for daily climatological data as well as no accepted method to apply the homogeneity results. There is a clear need for additional research on techniques for homogenisation of daily data in order to create high quality, daily datasets for the assessment of extremes without abandoning entire series or tossing out real extremes. This is of particular importance for areas that have a low density of stations with long, daily data series.[4]
Types of data display
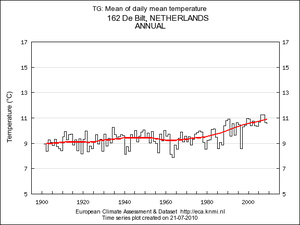
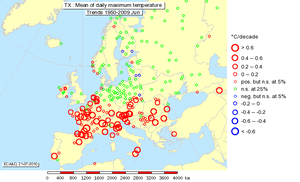
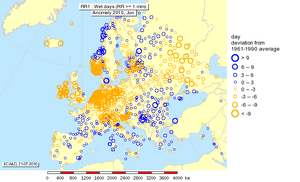
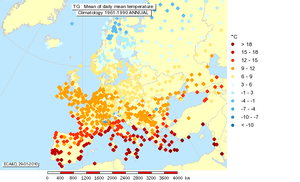
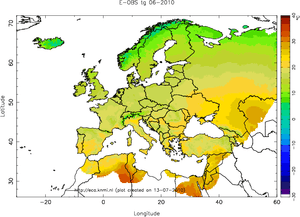
The data in the ECA&D database is accessible in many different ways. One can view Time series plots for each index and station, maps of trends over Europe for each index, maps of index anomalies (with respect to the normal period 1961-1990) for a particular year or season, as well as climatology maps depicting index behavior for two periods in the past: 1961–1990 and 1971–2000. One can also request daily data (minimum, mean and maximum temperature as well as precipitation amount) via a custom query in ASCII format, by downloading predefined ASCII subsets, or by accessing the E–OBS daily gridded dataset through the ENSEMBLES project (see below). Both the ASCII custom queries and the predefined ASCII subsets are available for both blended and non-blended data.
In order to better evaluate the intensity and frequency of rare events, the website also offers the option to view maps of return values for events that occur once in two, five, ten and fifty years. To determine the return values, a Gumbel distribution is fit to the seasonal maxima for the chosen period and season for several temperature and precipitation extremes over Europe.[5]
In addition to calculating return values, the website allows users to investigate particular extreme events that have occurred in the past. Included is a brief description of the event plus figures from the ECA&D database that describe the significance of the event placed in the context of climate change. However, single events cannot simply and directly be attributed to anthropogenic climate change as there is always a finite chance that the event in question may have occurred within natural variability; but, according to the latest report from the Intergovernmental Panel on Climate Change (IPCC), "Confidence has increased that some extremes will become more frequent, widespread and/or more intense during the 21st century."[6]
E–OBS daily gridded dataset
The E–OBS daily gridded dataset is a European land-only, high-resolution gridded observational dataset produced using the ECA&D blended daily station data. The dataset covers the area 25–75N x 40W–75E and comes in two grid flavours with two resolutions: a 0.22° and 0.44° rotated grid (North Pole at 39.25N, 162W) and a 0.25° and 0.50° regular grid. The current version 3.0 was released in April, 2010 and covers 1950–2009. Monthly updates for the current year are available.
The dataset is freely available for non-commercial research and non-commercial education projects only through the ENSEMBLES project. The number of current users is now in excess of 800.[7]
Related projects
The station observations in the ECA&D project are used in several other related activities.
ENSEMBLES
The E–OBS daily gridded dataset covering Europe, the Middle East and Northern Africa has been developed as part of the ENSEMBLES project and is available from 1950 onwards.
European Reanalysis and Observations for Monitoring (EURO4M)
EURO4M is a European Union-funded project which will run between April 2010 and March 2014,[8] and it is hoped to be Europe's primary source of timely and reliable information about the state of the European climate. With its enhanced climate monitoring capability – combining observations from ground-based stations, satellites and model-based reanalysis – climate change can be better understood and predicted. Near real-time updates for the E–OBS daily gridded dataset will be used for the monitoring of extreme events in EURO4M.
References
- Klein–Tank et al.,"Daily dataset of 20th-century surface air temperature and precipitation series for the European climate assessment", Int. J. Climatol., 22: 1441–1453 (2002). Retrieved on 2010-01-29. Archived October 18, 2006[Date mismatch], at the Wayback Machine
- Albert Klein–Tank, European Climate Assessment and Dataset (ECA&D) [http://www.ecad.eu/documents/ecad_atbd.pdfdead link]ECA&D Algorithm Theoretical Basis Document (ATBD). Retrieved on 2010-01-29.
- Wijngaard et al.,Homogeneity of 20th century European daily temperature and precipitation series, Int. J. Climatol., 23: 679–692 (2003). Retrieved on 2010-01-29. Archived June 4, 2011[Date mismatch], at the Wayback Machine
- Advances in homogenisation methods of climate series: an integrated approach (HOME) Retrieved on 2010-02-04.
- =Guidelines on Analysis of extremes in a changing climate in support of informed decisions for adaptation Retrieved on 2010-02-04. Archived October 27, 2011[Date mismatch], at the Wayback Machine
- IPCC Fourth Assessment Report: Working Group I Report "The Physical Science Basis" Retrieved on 2010-02-04. Archived January 19, 2010, at the Wayback Machine
- Hofstra et al., Testing E–OBS European high-resolution gridded dataset of daily precipitation and surface temperature, J. Geophys. Res., 114, D21101, ] doi:10.1029/2009JD011799. Retrieved on 2010-01-29.
- European Reanalysis And Observations For Monitoring (EURO4M)
External links
- European Climate Assessment and Dataset (ECA&D)
- Royal Netherlands Meteorological Institute (Dutch: Koninklijk Nederlands Meteorologisch Instituut) (KNMI)
- European Climate Support Network (ECSN)
- Network of European Meteorological Services (EUMETNET)
- ECA&D Algorithm Theoretical Basis Document
- Regional Climate Centres
- World Meteorological Organization Region VI (Europe and the Middle East)
- National Meteorological or Hydrometeorological Services of Members
- CCI/CLIVAR/JCOMM Expert Team on Climate Change Detection and Indices
- ENSEMBLES