Cynthia Brewer
Cynthia A. Brewer is an American professor of geography at the Pennsylvania State University, Pennsylvania, and author. She has worked as a map and atlas design consultant for the U.S. Census Bureau, National Cancer Institute, National Center for Health Statistics, and National Park Service. She teaches the introductory cartography and map design courses.[1] Her specialism relates to visibility and color theory in cartography. She also works on topographic map design, multi-scale mapping, generalization, atlas mapping. She has been influential as a theorist for map representations and influences GIS professionals.
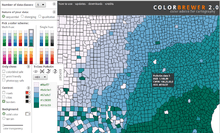
Her web, print, and colorblind-friendly set of colors known as ColorBrewer colors.[2] have been used by numerous projects. She is responsible for the Apache 2.0 licensed web application ColorBrewer
Education
She graduated from McMaster University (Ontario, Canada) in 1979 and University of Guelph (Ontario, Canada) in 1983. She did her master's degree in geography with emphasis in cartography, Michigan State University, 1983 to 1986, presenting a thesis on The Development of Process-Printed Munsell Charts for Selecting Map Colors. After a year at University of California at Santa Barbara she obtained her doctorate from Michigan State University in 1991. Her dissertation was Prediction of Surround-Induced Changes in Map Color Appearance[3]
Academic career
She was visiting lecturer at the University of California at Santa Barbara, Department of Geography during the year 1986/87. On completing her doctorate she was assistant professor, for three years (1991 to 1994) at San Diego State University. She joined the Pennsylvania State University, Department of Geography in 1994 and has been professor since 2007 and head of department since 2014.
Affiliate faculty member of the Center of Excellence for Geospatial Information Science (CEGIS), U.S. Geological Survey, Department of Interior, since 2008.[3]
ColorBrewer

Choosing effective colour schemes for thematic maps, (or Choropleths) is unexpectedly complex. A sequence of colors has to be selected to represent the data. For deciles, ten related colors must be selected. These colors can be chosen according to sequential, diverging and qualitative schemes. The results must consider the end-use environment for the map (e.g., CRT, LCD, printed, projected, photocopied). There are five colour specification systems with numbers commonly written in hexadecimal and decimal.[4]
ColorBrewer is an online tool designed to take some of the guesswork out of this process by helping users select appropriate colour schemes for their specific mapping needs. It was launched in 2002. It is licensed using Apache 2.0 software license which is similar to CC-BY-SA 3.0. [4]
Brewer palettes
Valid names and full color representation for each palette. Moving the mouse cursor over each box the color number appears.
- YlGn
- YlGnBu
- GnBu
- BuGn
- PuBuGn
- PuBu
- BuPu
- RdPu
- PuRd
- OrRd
- YlOrRd
- YlOrBr
- Purples
- Blues
- Greens
- Oranges
- Reds
- Greys
- PuOr
- BrBG
- PRGn
- PiYG
- RdBu
- RdGy
- RdYlBu
- Spectral
- RdYlGn
- Accent
- Dark2
- Paired
- Pastel1
- Pastel2
- Set1
- Set2
- Set3
Further research
Most of this work is applicable to computer based GIS work. Leading from the original work, investigations have been made into schemes for differing types of colorblindness.[2] Other cartographers in this field include Gretchen N Petersen [5] and Cindy's mentor Judy M Olson, Professor Emerita: Department of Geography, Michigan State University.[3]
See also
References
- Brewer, Cynthia (30 July 2005). Designing Better Maps: A Guide for GIS Users. Esri Press. ASIN 1589480899.
- Stephen D. Gardner, 2005, Evaluation of the ColorBrewer Color Schemes for Accommodation of Map Readers with Impaired Color Vision (6.1MB PDF)
- "Brewer, Cynthia | Penn State Department of Geography". www.geog.psu.edu. Penn State. Archived from the original on 20 March 2017. Retrieved 26 February 2017.
- Harrower & Brewer 2003.
- Kent, Alexander J. (2013), "Cartographer's Toolkit: Colors, Typography, Patterns by Gretchen N. Peterson (review)", Cartographica, 48 (1): 71–72, doi:10.1353/car.2013.0006
Publications
Books
- Brewer, Cynthia A. (2005), Designing Better Maps: A Guide for GIS Users, Esri Press, p. 220, ISBN 978-1589480896
- Brewer, Cynthia A. (2008), Designed Maps: A Sourcebook for GIS Users, Esri Press, p. 184, ISBN 978-1589481602
- Brewer, Cynthia A. (2015), Designing Better Maps: A Guide for GIS Users, 2nd Edition, Esri Press, p. 250, ISBN 978-1589484405
Articles
- Harrower, Mark; Brewer, Cynthia A. (2003), "ColorBrewer.org: An Online Tool for Selecting Colour Schemes for Maps" (PDF), The Cartographic Journal, 40 (1): 27–37, doi:10.1179/000870403235002042, archived from the original (PDF) on 2013-05-10, retrieved 2013-01-03
- Brewer, Cynthia A. (2006), "Basic Mapping Principles for Visualizing Cancer Data Using Geographic Information Systems (GIS)" (PDF), American Journal of Preventive Medicine, 30 (2): S25–S36, doi:10.1016/j.amepre.2005.09.007, PMID 16458787, archived from the original (PDF) on 2010-06-25
- Brewer, Cynthia A.; Hatchard, Geoffrey W.; Harrower, Mark A (2003), "ColorBrewer in Print: A Catalog of Color Schemes for Maps", Cartography and Geographic Information Science, 30 (1): 5–32 (28), doi:10.1559/152304003100010929
- Brewer, Cynthia A. (2003), "A Transition in Improving Maps: The ColorBrewer Example", Cartography and Geographic Information Science, 30 (2): 159–162(4), doi:10.1559/152304003100011126
- Brewer, Cynthia A. (1996), "Guidelines for Selecting Colors for Diverging Schemes on Maps", The Cartographic Journal, 33 (2): 79–86(8), doi:10.1179/caj.1996.33.2.79
- An Evaluation of Color Selections to Accommodate Map Users with Color-Vision Impairments
External links
- personal page
- ColorBrewer2.org — for sequential, diverging, and qualitative color ramps. Web, print, and colorblind friendly.