Caplan, Quebec
Caplan is a municipality in the Gaspésie–Îles-de-la-Madeleine region of the province of Quebec in Canada.
Caplan | |
|---|---|
Municipality | |
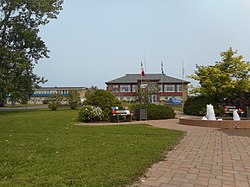 Caplan City Hall | |
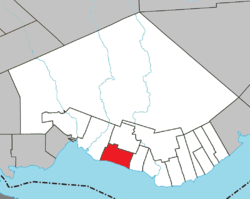 Location within Bonaventure RCM. | |
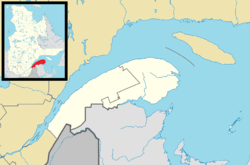 Caplan Location in eastern Quebec. | |
| Coordinates: 48°06′N 65°41′W[1] | |
| Country | |
| Province | |
| Region | Gaspésie– Îles-de-la-Madeleine |
| RCM | Bonaventure |
| Constituted | January 1, 1875 |
| Government | |
| • Mayor | Doris Boissonnault |
| • Federal riding | Gaspésie— Îles-de-la-Madeleine |
| • Prov. riding | Bonaventure |
| Area | |
| • Total | 85.10 km2 (32.86 sq mi) |
| • Land | 85.87 km2 (33.15 sq mi) |
| There is an apparent contradiction between two authoritative sources | |
| Population (2011)[4] | |
| • Total | 2,039 |
| • Density | 23.7/km2 (61/sq mi) |
| • Pop 2006-2011 | |
| • Dwellings | 965 |
| Time zone | UTC−5 (EST) |
| • Summer (DST) | UTC−4 (EDT) |
| Postal code(s) | G0C 1H0 |
| Area code(s) | 418 and 581 |
| Highways | |
| Website | www.municipalite caplan.com |
There are various explanations as to the origin of the name Caplan, including: a corruption of capelin or Cape Land; from the surname of a certain John Kaplan, an Indian who long camped at this location; or from the Mi'kmaq word gaplanjetig (meaning "capelin").[1]
The place was incorporated in 1875 as the Parish Municipality of Saint-Charles-de-Caplan. In 1964, it changed its status and was renamed to Municipality of Caplan.[1]
Demographics
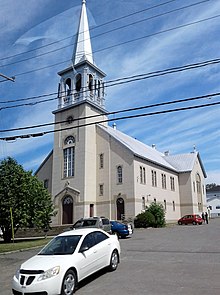
Saint Charles Church in Caplan
Population
| Canada census – Caplan, Quebec community profile | |||
|---|---|---|---|
| 2011 | 2006 | ||
| Population: | 2,039 (+8.2% from 2006) | 1,884 (-6.3% from 2001) | |
| Land area: | 85.87 km2 (33.15 sq mi) | 85.87 km2 (33.15 sq mi) | |
| Population density: | 23.7/km2 (61/sq mi) | 21.9/km2 (57/sq mi) | |
| Median age: | 51.8 (M: 51.9, F: 51.8) | 46.4 (M: 46.2, F: 46.4) | |
| Total private dwellings: | 965 | 870 | |
| Median household income: | $44,571 | $35,017 | |
| References: 2011[4] 2006[5] earlier[6] | |||
|
|
|
Language
| Canada Census Mother Tongue Language - Caplan, Quebec[7] | ||||||||||||||||||
|---|---|---|---|---|---|---|---|---|---|---|---|---|---|---|---|---|---|---|
| Census | French |
English |
French & English |
Other | ||||||||||||||
| Year | Count | Trend | Pop % | Count | Trend | Pop % | Count | Trend | Pop % | Count | Trend | Pop % | ||||||
2011 |
1,900 | 96.94% | 50 | 2.55% | 10 | 0.51% | 0 | 1.98% | ||||||||||
2006 |
1,810 | 96.53% | 40 | 2.13% | 0 | 0.00% | 25 | 1.33% | ||||||||||
2001 |
1,920 | 98.46% | 30 | 1.54% | 0 | 0.00% | 0 | 0.00% | ||||||||||
1996 |
2,025 | n/a | 97.12% | 40 | n/a | 1.92% | 20 | n/a | 0.96% | 0 | n/a | 0.00% | ||||||
Climate
| Climate data for Caplan, Quebec | |||||||||||||
|---|---|---|---|---|---|---|---|---|---|---|---|---|---|
| Month | Jan | Feb | Mar | Apr | May | Jun | Jul | Aug | Sep | Oct | Nov | Dec | Year |
| Record high °C (°F) | 10.0 (50.0) |
10.0 (50.0) |
17.0 (62.6) |
25.5 (77.9) |
29.4 (84.9) |
32.0 (89.6) |
34.4 (93.9) |
33.3 (91.9) |
30.0 (86.0) |
22.2 (72.0) |
18.3 (64.9) |
12.8 (55.0) |
34.4 (93.9) |
| Average high °C (°F) | −6.6 (20.1) |
−4.7 (23.5) |
0.5 (32.9) |
6.7 (44.1) |
14.3 (57.7) |
19.8 (67.6) |
22.7 (72.9) |
22.1 (71.8) |
17.0 (62.6) |
10.6 (51.1) |
3.4 (38.1) |
−2.7 (27.1) |
8.6 (47.5) |
| Daily mean °C (°F) | −11.3 (11.7) |
−9.7 (14.5) |
−4.2 (24.4) |
2.4 (36.3) |
9.1 (48.4) |
14.6 (58.3) |
17.8 (64.0) |
17.1 (62.8) |
12.4 (54.3) |
6.5 (43.7) |
0.1 (32.2) |
−6.7 (19.9) |
4.0 (39.2) |
| Average low °C (°F) | −16 (3) |
−14.7 (5.5) |
−8.9 (16.0) |
−1.9 (28.6) |
4.0 (39.2) |
9.3 (48.7) |
12.9 (55.2) |
12.1 (53.8) |
7.8 (46.0) |
2.4 (36.3) |
−3.3 (26.1) |
−10.6 (12.9) |
−0.6 (30.9) |
| Record low °C (°F) | −33.0 (−27.4) |
−29.4 (−20.9) |
−28.5 (−19.3) |
−18.0 (−0.4) |
−6.1 (21.0) |
−6.7 (19.9) |
1.5 (34.7) |
2.0 (35.6) |
−3.3 (26.1) |
−9.0 (15.8) |
−21.0 (−5.8) |
−27.5 (−17.5) |
−33.0 (−27.4) |
| Average precipitation mm (inches) | 79.8 (3.14) |
55.7 (2.19) |
60.4 (2.38) |
64.0 (2.52) |
91.8 (3.61) |
86.7 (3.41) |
99.8 (3.93) |
95.5 (3.76) |
79.0 (3.11) |
88.5 (3.48) |
86.0 (3.39) |
69.6 (2.74) |
956.7 (37.67) |
| Average rainfall mm (inches) | 15.4 (0.61) |
10.7 (0.42) |
28.9 (1.14) |
51.6 (2.03) |
91.7 (3.61) |
86.7 (3.41) |
99.8 (3.93) |
95.5 (3.76) |
79.0 (3.11) |
88.1 (3.47) |
70.3 (2.77) |
28.7 (1.13) |
746.4 (29.39) |
| Average snowfall cm (inches) | 64.4 (25.4) |
45.1 (17.8) |
31.5 (12.4) |
13.6 (5.4) |
0.1 (0.0) |
0.0 (0.0) |
0.0 (0.0) |
0.0 (0.0) |
0.0 (0.0) |
0.4 (0.2) |
15.6 (6.1) |
40.8 (16.1) |
211.5 (83.3) |
| Source: Environment Canada[8] | |||||||||||||
gollark: Replies CAN contain pings.
gollark: Wondrous.
gollark: Yes. I pinged you. Repeatedly.
gollark: Does anyone know who has the cheddar role now?
gollark: Testbot, take 6 ox.
See also
References
- "Caplan (Municipalité)" (in French). Commission de toponymie du Québec. Retrieved 2011-12-29.
- "Caplan". Répertoire des municipalités (in French). Ministère des Affaires municipales, des Régions et de l'Occupation du territoire. Archived from the original on 2012-05-01. Retrieved 2011-12-29.
- "Caplan census profile". 2011 Census data. Statistics Canada. Retrieved 2011-12-29.
- "2011 Community Profiles". 2011 Canadian Census. Statistics Canada. July 5, 2013. Retrieved 2014-01-30.
- "2006 Community Profiles". 2006 Canadian Census. Statistics Canada. March 30, 2011. Retrieved 2011-12-29.
- "2001 Community Profiles". 2001 Canadian Census. Statistics Canada. February 17, 2012.
- Statistics Canada: 1996, 2001, 2006, 2011 census
- "Caplan". Canadian Climate Normals 1981–2010 (in English and French). Environment Canada. Retrieved June 6, 2015.
Adjacent Municipal Subdivisions | ||||||||||
|---|---|---|---|---|---|---|---|---|---|---|
| ||||||||||
| Cities | |
|---|---|
| Municipalities | |
| Parishes | |
| Townships | |
| Unorganized Territories | |
| |
| Authority control |
|
|---|
This article is issued from Wikipedia. The text is licensed under Creative Commons - Attribution - Sharealike. Additional terms may apply for the media files.