Colorado's 3rd congressional district
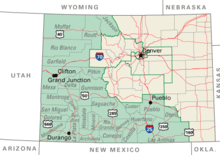
Colorado's 3rd congressional district is a congressional district in the U.S. state of Colorado. The district takes in most of the rural Western Slope in the state's western third, with a tendril in the south taking in the southern portions of the Eastern Plains. It includes the cities of Grand Junction, Durango, Aspen, Glenwood Springs and Pueblo.
| Colorado's 3rd congressional district | |||
|---|---|---|---|
.tif.png) Colorado's 3rd congressional district - since January 3, 2013. | |||
| Representative |
| ||
| Distribution |
| ||
| Population (2016) | 738,119[2] | ||
| Median income | $52,765[2] | ||
| Ethnicity |
| ||
| Cook PVI | R+6[3] | ||
The district is currently represented by Republican Scott R. Tipton, who defeated Democratic incumbent John Salazar in 2010.
The district is mainly rural and leans Republican (though not as much as the neighboring 4th district). However, there is some Democratic support in tourist counties and Pueblo, keeping the seat somewhat competitive.
History
1990s
Following the 1990 U.S. Census and associated realignment of Colorado congressional districts, the 3rd Congressional district consisted of Alamosa, Archuleta, Chaffee, Conejos, Costilla, Custer, Delta, Dolores, Eagle, Garfield, Grand, Gunnison, Hinsdale, Huerfano, Jackson, Lake, La Plata, Mesa, Mineral, Moffat, Montezuma, Montrose, Ouray, Park, Pitkin, Pueblo, Rio Blanco, Rio Grande, Routt, Saguache, San Juan, San Miguel and Summit counties, as well as portions of Douglas, Fremont, and Jefferson counties.
2000s
Following the 2000 U.S. Census and associated realignment of Colorado congressional districts, the 3rd Congressional district consisted of Alamosa, Archuleta, Conejos, Costilla, Custer, Delta, Dolores, Garfield, Gunnison, Hinsdale, Huerfano, Jackson, La Plata, Las Animas, Mesa, Mineral, Moffat, Montezuma, Montrose, Ouray, Pitkin, Pueblo, Rio Blanco, Rio Grande, Routt, Saguache, San Juan, and San Miguel counties and most of Otero County.
Characteristics
The district has two major population centers in Grand Junction and Pueblo. The two cities and their surrounding rural areas provide a competitive arena for congressional races. Grand Junction, on the Western Slope, is a Republican stronghold while Pueblo, a town with a large Latino population and (by Colorado norms) a heavily unionized workforce, provides a base of support for Democrats. The district leaned heavily Republican in the 1990s, but in recent years has become more competitive.
George W. Bush received 55% of the vote in the district in 2004 while John McCain won the district in 2008 50%–47%.
Recent results in statewide elections
Election results from presidential races[4]
| Year | Office | Results |
|---|---|---|
| 2000 | President | Bush 54 - 39% |
| 2004 | President | Bush 55 - 44% |
| 2008 | President | McCain 50 - 47% |
| 2012 | President | Romney 52 - 46% |
| 2016 | President | Trump 52 – 40% |
List of members representing the district
| Member (District home) |
Party | Term duration | Cong ress |
Electoral history | |
|---|---|---|---|---|---|
| District created March 4, 1915. | |||||
 Edward Keating (Pueblo) |
Democratic | March 4, 1915 – March 3, 1919 |
64th 65th |
Redistricted from the at-large district and re-elected in 1914. Re-elected in 1916. Lost re-election. | |
.jpg) Guy Urban Hardy (Canon City) |
Republican | March 4, 1919 – March 3, 1933 |
66th 67th 68th 69th 70th 71st 72nd |
Elected in 1918. Re-elected in 1920. Re-elected in 1922. Re-elected in 1924. Re-elected in 1926. Re-elected in 1928. Re-elected in 1930. Lost re-election. | |
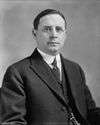
.jpg) John Andrew Martin (Pueblo) |
Democratic | March 4, 1933 – December 23, 1939 |
73rd 74th 75th 76th |
Elected in 1932. Re-elected in 1934. Re-elected in 1936. Re-elected in 1938. Died. | |
| Vacant | December 23, 1939 – November 5, 1940 |
76th | |||
.jpg) William Evans Burney (Pueblo) |
Democratic | November 5, 1940 – January 3, 1941 |
76th | Elected to finish Martin's term. Did not run for the next term. | |
.jpg) J. Edgar Chenoweth (Trinidad) |
Republican | January 3, 1941– January 3, 1949 |
77th 78th 79th 80th |
Elected in 1940. Re-elected in 1942. Re-elected in 1944. Re-elected in 1946. Lost re-election. | |
.jpg) John Henry Marsalis (Pueblo) |
Democratic | January 3, 1949 – January 3, 1951 |
81st | Elected in 1948. Lost re-election. | |
J. Edgar Chenoweth (Trinidad) |
Republican | January 3, 1951 – January 3, 1965 |
82nd 83rd 84th 85th 86th 87th 88th |
Re-elected in 1950. Re-elected in 1952. Re-elected in 1954. Re-elected in 1956. Re-elected in 1958. Re-elected in 1960. Re-elected in 1962. Lost renomination. | |
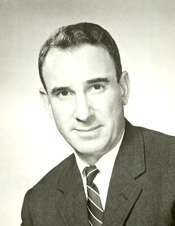 Frank Evans (Beulah) |
Democratic | January 3, 1965 – January 3, 1979 |
89th 90th 91st 92nd 93rd 94th 95th |
Elected in 1964. Re-elected in 1966. Re-elected in 1968. Re-elected in 1970. Re-elected in 1972. Re-elected in 1974. Re-elected in 1976. Retired. | |
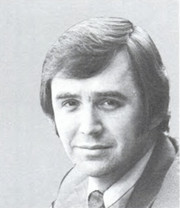 Ray Kogovsek (Pueblo) |
Democratic | January 3, 1979 – January 3, 1985 |
96th 97th 98th |
Elected in 1978. Re-elected in 1980. Re-elected in 1982. Retired. | |
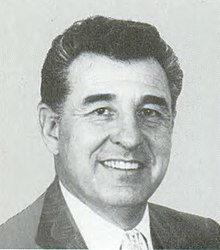
 Mike Strang (Carbondale) |
Republican | January 3, 1985 – January 3, 1987 |
99th | Elected in 1984. Lost re-election. | |
 Ben Nighthorse Campbell (Ignacio) |
Democratic | January 3, 1987 – January 3, 1993 |
100th 101st 102nd |
Elected in 1986. Re-elected in 1988. Re-elected in 1990. Retired to run for U.S. senator. | |
 Scott McInnis (Glenwood Springs) |
Republican | January 3, 1993 – January 3, 2005 |
103rd 104th 105th 106th 107th 108th |
Elected in 1992. Re-elected in 1994. Re-elected in 1996. Re-elected in 1998. Re-elected in 2000. Re-elected in 2002. Retired. | |
 John Salazar (Manassa) |
Democratic | January 3, 2005 – January 3, 2011 |
109th 110th 111th |
Elected in 2004. Re-elected in 2006. Re-elected in 2008. Lost re-election. | |
 Scott Tipton (Cortez) |
Republican | January 3, 2011 – present |
112th 113th 114th 115th 116th |
Elected in 2010. Re-elected in 2012. Re-elected in 2014. Re-elected in 2016. Re-elected in 2018. Lost renomination. | |
| TBD | January 3, 2021 – |
117th | Elected in 2020. | ||
Election results
|
1914 • 1916 • 1918 • 1920 • 1922 • 1924 • 1926 • 1928 • 1930 • 1932 • 1934 • 1936 • 1938 • 1940 (Special) • 1940 • 1942 • 1944 • 1946 • 1948 • 1950 • 1952 • 1954 • 1956 • 1958 • 1960 • 1962 • 1964 • 1966 • 1968 • 1970 • 1972 • 1974 • 1976 • 1978 • 1980 • 1982 • 1984 • 1986 • 1988 • 1990 • 1992 • 1994 • 1996 • 1998 • 2000 • 2002 • 2004 • 2006 • 2008 • 2010 • 2012 • 2014 • 2016 • 2018 |
1914
| Party | Candidate | Votes | % | ||
|---|---|---|---|---|---|
| Democratic | Edward Keating | 37,191 | 53% | ||
| Republican | Neil N. McLean | 32,567 | 47% | ||
| Total votes | 69,758 | 100% | |||
| Democratic win (new seat) | |||||
1916
| Party | Candidate | Votes | % | |
|---|---|---|---|---|
| Democratic | Edward Keating (Incumbent) | 40,183 | 54% | |
| Republican | George E. McClelland | 31,137 | 42% | |
| Socialist | David McGrew | 2,492 | 3% | |
| Progressive | William G. Francis | 443 | 1% | |
| Total votes | 74,255 | 100% | ||
| Democratic hold | ||||
1918
| Party | Candidate | Votes | % | |||
|---|---|---|---|---|---|---|
| Republican | Guy U. Hardy | 31,715 | 51% | |||
| Democratic | Edward Keating (Incumbent) | 29,075 | 47% | |||
| Socialist | Edith Halcomb | 1,453 | 2% | |||
| Total votes | 62,243 | 100% | ||||
| Republican gain from Democratic | ||||||
1920
| Party | Candidate | Votes | % | |
|---|---|---|---|---|
| Republican | Guy U. Hardy (Incumbent) | 43,426 | 58% | |
| Democratic | Samuel J. Burris | 31,896 | 42% | |
| Total votes | 75,322 | 100% | ||
| Republican hold | ||||
1922
| Party | Candidate | Votes | % | |
|---|---|---|---|---|
| Republican | Guy U. Hardy (Incumbent) | 43,508 | 52% | |
| Democratic | Chester B. Horn | 39,500 | 48% | |
| Total votes | 83,008 | 100% | ||
| Republican hold | ||||
1924
| Party | Candidate | Votes | % | |
|---|---|---|---|---|
| Republican | Guy U. Hardy (Incumbent) | 53,877 | 59% | |
| Democratic | Charles B. Hughes | 37,976 | 41% | |
| Total votes | 91,853 | 100% | ||
| Republican hold | ||||
1926
| Party | Candidate | Votes | % | |
|---|---|---|---|---|
| Republican | Guy U. Hardy (Incumbent) | 46,916 | 54% | |
| Democratic | Edmond I. Crockett | 40,009 | 46% | |
| Total votes | 86,925 | 100% | ||
| Republican hold | ||||
1928
| Party | Candidate | Votes | % | |
|---|---|---|---|---|
| Republican | Guy U. Hardy (Incumbent) | 64,116 | 65% | |
| Democratic | Harry A. McIntyre | 34,670 | 35% | |
| Total votes | 98,786 | 100% | ||
| Republican hold | ||||
1930
| Party | Candidate | Votes | % | |
|---|---|---|---|---|
| Republican | Guy U. Hardy (Incumbent) | 55,170 | 61% | |
| Democratic | Guy M. Weybright | 35,744 | 39% | |
| Total votes | 90,914 | 100% | ||
| Republican hold | ||||
1932
| Party | Candidate | Votes | % | |||
|---|---|---|---|---|---|---|
| Democratic | John Andrew Martin | 59,882 | 51% | |||
| Republican | Guy U. Hardy (Incumbent) | 57,793 | 49% | |||
| Total votes | 117,675 | 100% | ||||
| Democratic gain from Republican | ||||||
1934
| Party | Candidate | Votes | % | |
|---|---|---|---|---|
| Democratic | John Andrew Martin (Incumbent) | 73,281 | 64% | |
| Republican | W.O. Peterson | 39,753 | 35% | |
| Socialist | Joseph T. Landis | 1,199 | 1% | |
| Total votes | 114,233 | 100% | ||
| Democratic hold | ||||
1936
| Party | Candidate | Votes | % | |
|---|---|---|---|---|
| Democratic | John Andrew Martin (Incumbent) | 74,013 | 60% | |
| Republican | J. Arthur Phelps | 48,871 | 40% | |
| Total votes | 122,884 | 100% | ||
| Democratic hold | ||||
1938
| Party | Candidate | Votes | % | |
|---|---|---|---|---|
| Democratic | John Andrew Martin (Incumbent) | 72,736 | 57% | |
| Republican | Henry Leonard | 54,007 | 43% | |
| Total votes | 126,743 | 100% | ||
| Democratic hold | ||||
1940 (Special)
| Party | Candidate | Votes | % | |
|---|---|---|---|---|
| Democratic | William E. Burney | 68,225 | 51% | |
| Republican | Henry Leonard | 65,675 | 49% | |
| Total votes | 133,900 | 100% | ||
| Democratic hold | ||||
1940
| Party | Candidate | Votes | % | |||
|---|---|---|---|---|---|---|
| Republican | John Chenoweth | 70,842 | 52% | |||
| Democratic | Byron G. Rogers | 65,269 | 48% | |||
| Total votes | 136,111 | 100% | ||||
| Republican gain from Democratic | ||||||
1942
| Party | Candidate | Votes | % | |
|---|---|---|---|---|
| Republican | John Chenoweth (Incumbent) | 55,838 | 63% | |
| Democratic | J.C. Jarrett | 33,154 | 37% | |
| Total votes | 88,992 | 100% | ||
| Republican hold | ||||
1944
| Party | Candidate | Votes | % | |
|---|---|---|---|---|
| Republican | John Chenoweth (Incumbent) | 69,492 | 56% | |
| Democratic | Arthur M. Wimmell | 53,904 | 44% | |
| Total votes | 123,396 | 100% | ||
| Republican hold | ||||
1946
| Party | Candidate | Votes | % | |
|---|---|---|---|---|
| Republican | John Chenoweth (Incumbent) | 45,043 | 55% | |
| Democratic | Walter Walford Johnson | 37,496 | 45% | |
| Total votes | 82,539 | 100% | ||
| Republican hold | ||||
1948
| Party | Candidate | Votes | % | |||
|---|---|---|---|---|---|---|
| Democratic | John H. Marsalis | 65,114 | 51% | |||
| Republican | John Chenoweth (Incumbent) | 63,312 | 49% | |||
| Total votes | 128,426 | 100% | ||||
| Democratic gain from Republican | ||||||
1950
| Party | Candidate | Votes | % | |||
|---|---|---|---|---|---|---|
| Republican | John Chenoweth | 58,831 | 52% | |||
| Democratic | John H. Marsalis (Incumbent) | 55,110 | 48% | |||
| Total votes | 113,941 | 100% | ||||
| Republican gain from Democratic | ||||||
1952
| Party | Candidate | Votes | % | |
|---|---|---|---|---|
| Republican | John Chenoweth (Incumbent) | 84,739 | 58% | |
| Democratic | John H. Marsalis | 62,025 | 42% | |
| Total votes | 146,764 | 100% | ||
| Republican hold | ||||
1954
| Party | Candidate | Votes | % | |
|---|---|---|---|---|
| Republican | John Chenoweth (Incumbent) | 62,884 | 53% | |
| Democratic | Alva B. Adams Jr. | 55,750 | 47% | |
| Total votes | 118,634 | 100% | ||
| Republican hold | ||||
1956
| Party | Candidate | Votes | % | |
|---|---|---|---|---|
| Republican | John Chenoweth (Incumbent) | 74,196 | 50% | |
| Democratic | Alva B. Adams Jr. | 73,501 | 50% | |
| Total votes | 147,697 | 100% | ||
| Republican hold | ||||
1958
| Party | Candidate | Votes | % | |
|---|---|---|---|---|
| Republican | John Chenoweth (Incumbent) | 63,655 | 50% | |
| Democratic | Fred M. Betz | 63,112 | 50% | |
| Total votes | 126,767 | 100% | ||
| Republican hold | ||||
1960
| Party | Candidate | Votes | % | |
|---|---|---|---|---|
| Republican | John Chenoweth (Incumbent) | 85,825 | 52% | |
| Democratic | Franklin R. Stewart | 79,069 | 48% | |
| Total votes | 164,894 | 100% | ||
| Republican hold | ||||
1962
| Party | Candidate | Votes | % | |
|---|---|---|---|---|
| Republican | John Chenoweth (Incumbent) | 74,848 | 55% | |
| Democratic | Albert "Al" Tomsic | 62,097 | 45% | |
| Total votes | 136,945 | 100% | ||
| Republican hold | ||||
1964
| Party | Candidate | Votes | % | |||
|---|---|---|---|---|---|---|
| Democratic | Frank Evans | 85,404 | 51% | |||
| Republican | John Chenoweth (Incumbent) | 81,544 | 49% | |||
| Total votes | 166,948 | 100% | ||||
| Democratic gain from Republican | ||||||
1966
| Party | Candidate | Votes | % | |
|---|---|---|---|---|
| Democratic | Frank Evans (Incumbent) | 76,270 | 52% | |
| Republican | David W. Enoch | 71,213 | 48% | |
| Total votes | 147,483 | 100% | ||
| Democratic hold | ||||
1968
| Party | Candidate | Votes | % | |
|---|---|---|---|---|
| Democratic | Frank Evans (Incumbent) | 88,368 | 52% | |
| Republican | Paul Bradley | 81,163 | 48% | |
| Total votes | 169,531 | 100% | ||
| Democratic hold | ||||
1970
| Party | Candidate | Votes | % | |
|---|---|---|---|---|
| Democratic | Frank Evans (Incumbent) | 87,000 | 64% | |
| Republican | John "Jack" Mitchell Jr. | 45,610 | 33% | |
| Raza Unida | Martin P. Serna | 1,828 | 1% | |
| Peace Independent | Walter Cranson | 1,598 | 1% | |
| American Independent | Henry John Olshaw | 652 | 1% | |
| Total votes | 136,688 | 100% | ||
| Democratic hold | ||||
1972
| Party | Candidate | Votes | % | |
|---|---|---|---|---|
| Democratic | Frank Evans (Incumbent) | 107,511 | 66% | |
| Republican | Chuck Brady | 54,556 | 34% | |
| Total votes | 162,067 | 100% | ||
| Democratic hold | ||||
1974
| Party | Candidate | Votes | % | |
|---|---|---|---|---|
| Democratic | Frank Evans (Incumbent) | 91,783 | 68% | |
| Republican | E. Keith Records | 43,298 | 32% | |
| Total votes | 135,081 | 100% | ||
| Democratic hold | ||||
1976
| Party | Candidate | Votes | % | |
|---|---|---|---|---|
| Democratic | Frank Evans (Incumbent) | 89,302 | 51% | |
| Republican | Melvin Takaki | 82,315 | 47% | |
| Raza Unida | Alfredo Archer | 2,429 | 1% | |
| American Independent | Henry John Olshaw | 1,186 | 1% | |
| Total votes | 175,232 | 100% | ||
| Democratic hold | ||||
1978
| Party | Candidate | Votes | % | |
|---|---|---|---|---|
| Democratic | Raymond P. Kogovsek | 69,669 | 49% | |
| Republican | Harold L. McCormick | 69,303 | 49% | |
| American Independent | Henry John Olshaw | 2,475 | 2% | |
| Total votes | 141,447 | 100% | ||
| Democratic hold | ||||
1980
| Party | Candidate | Votes | % | |
|---|---|---|---|---|
| Democratic | Raymond P. Kogovsek (Incumbent) | 105,820 | 55% | |
| Republican | Harold L. McCormick | 84,292 | 44% | |
| Libertarian | James S. Glennie | 2,670 | 1% | |
| Total votes | 192,782 | 100% | ||
| Democratic hold | ||||
1982
| Party | Candidate | Votes | % | |
|---|---|---|---|---|
| Democratic | Raymond P. Kogovsek (Incumbent) | 92,384 | 53% | |
| Republican | Tom Wiena | 77,409 | 45% | |
| Libertarian | Paul "Stormy" Mohn | 2,439 | 1% | |
| Independent | Henry John Olshaw | 656 | 1% | |
| Total votes | 172,888 | 100% | ||
| Democratic hold | ||||
1984
| Party | Candidate | Votes | % | |||
|---|---|---|---|---|---|---|
| Republican | Michael L. Strang | 122,669 | 57% | |||
| Democratic | W. Mitchell | 90,963 | 42% | |||
| Libertarian | Robert Jahelka | 1,358 | 0.5% | |||
| Independent | Henry John Olshaw | 880 | 0.5% | |||
| Total votes | 215,870 | 100% | ||||
| Republican gain from Democratic | ||||||
1986
| Party | Candidate | Votes | % | |||
|---|---|---|---|---|---|---|
| Democratic | Ben Nighthorse Campbell | 95,353 | 52% | |||
| Republican | Michael L. Strang (Incumbent) | 88,508 | 48% | |||
| Total votes | 183,861 | 100% | ||||
| Democratic gain from Republican | ||||||
1988
| Party | Candidate | Votes | % | |
|---|---|---|---|---|
| Democratic | Ben Nighthorse Campbell (Incumbent) | 169,284 | 78% | |
| Republican | Jim Zartman | 47,625 | 22% | |
| Total votes | 216,909 | 100% | ||
| Democratic hold | ||||
1990
| Party | Candidate | Votes | % | |
|---|---|---|---|---|
| Democratic | Ben Nighthorse Campbell (Incumbent) | 124,487 | 70% | |
| Republican | Bob Ellis | 49,961 | 28% | |
| Populist | Howard E. Fields | 2,859 | 2% | |
| Total votes | 177,307 | 100% | ||
| Democratic hold | ||||
1992
| Party | Candidate | Votes | % | |||
|---|---|---|---|---|---|---|
| Republican | Scott McInnis | 143,293 | 55% | |||
| Democratic | Mike Callihan | 114,480 | 44% | |||
| Populist | Ki R. Nelson | 4,189 | 1% | |||
| Total votes | 261,962 | 100% | ||||
| Republican gain from Democratic | ||||||
1994
| Party | Candidate | Votes | % | |
|---|---|---|---|---|
| Republican | Scott McInnis (Incumbent) | 145,365 | 70% | |
| Democratic | Linda Powers | 63,427 | 30% | |
| Total votes | 208,792 | 100% | ||
| Republican hold | ||||
1996
| Party | Candidate | Votes | % | |
|---|---|---|---|---|
| Republican | Scott McInnis (Incumbent) | 183,523 | 69% | |
| Democratic | Albert Gurule | 82,953 | 31% | |
| Total votes | 266,476 | 100% | ||
| Republican hold | ||||
1998
| Party | Candidate | Votes | % | |
|---|---|---|---|---|
| Republican | Scott McInnis (Incumbent) | 156,501 | 66% | |
| Democratic | Robert Reed Kelley | 74,479 | 32% | |
| Libertarian | Barry Baggert | 5,673 | 2% | |
| Total votes | 236,653 | 100% | ||
| Republican hold | ||||
2000
| Party | Candidate | Votes | % | |
|---|---|---|---|---|
| Republican | Scott McInnis (Incumbent) | 199,204 | 66% | |
| Democratic | Curtis Imrie | 87,921 | 29% | |
| Libertarian | Drew Sakson | 9,982 | 3% | |
| Reform | Victor A. Good | 5,433 | 2% | |
| Total votes | 302,540 | 100% | ||
| Republican hold | ||||
2002
| Party | Candidate | Votes | % | |
|---|---|---|---|---|
| Republican | Scott McInnis (Incumbent) | 143,433 | 66% | |
| Democratic | Dennis Berckefeldt | 68,160 | 31% | |
| Libertarian | J. Brent Shroyer | 4,370 | 2% | |
| Natural Law | Gary W. Swing | 1,903 | 0.5% | |
| Write-in | Jason Alessio | 106 | 0.05 | |
| Total votes | 217,972 | 100% | ||
| Republican hold | ||||
2004
| Party | Candidate | Votes | % | |||
|---|---|---|---|---|---|---|
| Democratic | John Salazar | 153,500 | 51% | |||
| Republican | Greg Walcher | 141,376 | 47% | |||
| Unaffiliated | Jim Krug | 8,770 | 2% | |||
| Total votes | 303,646 | 100% | ||||
| Democratic gain from Republican | ||||||
2006
| Party | Candidate | Votes | % | |
|---|---|---|---|---|
| Democratic | John Salazar (Incumbent) | 146,488 | 62% | |
| Republican | Scott Tipton | 86,930 | 37% | |
| Libertarian | Bert L. Sargent | 4,417 | 1% | |
| Green | Bruce E. Lohmiller (as a write-in) | 23 | 0% | |
| Total votes | 237,858 | 100% | ||
| Democratic hold | ||||
2008
| Party | Candidate | Votes | % | |
|---|---|---|---|---|
| Democratic | John Salazar (Incumbent) | 203,457 | 62% | |
| Republican | Wayne Wolf | 126,762 | 38% | |
| Total votes | 330,219 | 100% | ||
| Democratic hold | ||||
2010
| Party | Candidate | Votes | % | |||
|---|---|---|---|---|---|---|
| Republican | Scott Tipton | 129,257 | 50% | |||
| Democratic | John Salazar (Incumbent) | 118,048 | 46% | |||
| Libertarian | Gregory Gilman | 5,678 | 2% | |||
| Independent | Jake Segrest | 4,982 | 2% | |||
| Write-in | John W. Hargis Sr. | 23 | 0.00 | |||
| Write-in | Jim Fritz | 11 | 0.00 | |||
| Total votes | 257,999 | 100% | ||||
| Republican gain from Democratic | ||||||
2012
| Party | Candidate | Votes | % | |
|---|---|---|---|---|
| Republican | Scott Tipton (Incumbent) | 185,291 | 53% | |
| Democratic | Sal Pace | 142,619 | 41% | |
| Independent | Tisha Casida | 11,125 | 4% | |
| Libertarian | Gregory Gilman | 4,982 | 2% | |
| Total votes | 347,247 | 100% | ||
| Republican hold | ||||
2014
| Party | Candidate | Votes | % | |
|---|---|---|---|---|
| Republican | Scott Tipton (Incumbent) | 163,011 | 58% | |
| Democratic | Abel Tapia | 100,364 | 36% | |
| Independent | Tisha Casida | 11,294 | 4% | |
| Libertarian | Travis Mero | 6,472 | 2% | |
| Total votes | 281,143 | 100% | ||
| Republican hold | ||||
2016
| Party | Candidate | Votes | % | |
|---|---|---|---|---|
| Republican | Scott Tipton (Incumbent) | 204,220 | 54.60% | |
| Democratic | Gail Schwartz | 150,914 | 40.35% | |
| Libertarian | Gaylon Kent | 18,903 | 5.05% | |
| Total votes | 374,037 | 100% | ||
| Republican hold | ||||
2018
| Party | Candidate | Votes | % | |
|---|---|---|---|---|
| Republican | Scott Tipton (Incumbent) | 173,205 | 51.52% | |
| Democratic | Diane Mitsch Bush | 146,426 | 43.55% | |
| Independent | Mary Malarsie | 10,831 | 3.22% | |
| Libertarian | Gaylon Kent | 5,727 | 1.71% | |
| Total votes | 336,189 | 100% | ||
| Republican hold | ||||
Historical district boundaries
References
- Martis, Kenneth C. (1989). The Historical Atlas of Political Parties in the United States Congress. New York: Macmillan Publishing Company.
- Martis, Kenneth C. (1982). The Historical Atlas of United States Congressional Districts. New York: Macmillan Publishing Company.
- Congressional Biographical Directory of the United States 1774–present
- https://www.census.gov/geo/maps-data/data/cd_state.html
- Center for New Media & Promotion (CNMP), US Census Bureau. "My Congressional District". www.census.gov.
- "Partisan Voting Index – Districts of the 115th Congress" (PDF). The Cook Political Report. April 7, 2017. Retrieved April 7, 2017.
- Presidential Election Results, by district, swingstateproject.com
- "Our Campaigns - CO District 3 Race - Nov 03, 1914". www.ourcampaigns.com.
- "Our Campaigns - CO District 3 Race - Nov 07, 1916". www.ourcampaigns.com.
- "Our Campaigns - CO District 3 Race - Nov 05, 1918". www.ourcampaigns.com.
- "1920 Election Results" (PDF).
- "1922 Election Results" (PDF).
- "1924 Election Results" (PDF).
- "1926 Election Results" (PDF).
- "1928 Election Results" (PDF).
- "1930 Election Results" (PDF).
- "1932 Election Results" (PDF).
- "1934 Election Results" (PDF).
- "1936 Election Results" (PDF).
- "1938 Election Results" (PDF).
- "Our Campaigns - CO District 3 - Special Election Race - Nov 05, 1940". www.ourcampaigns.com.
- "1940 Election Results" (PDF).
- "1942 Election Results" (PDF).
- "1944 Election Results" (PDF).
- "1946 Election Results" (PDF).
- "1948 Election Results" (PDF).
- "1950 Election Results" (PDF).
- "1952 Election Results" (PDF).
- "1954 Election Results" (PDF).
- "1956 Election Results" (PDF).
- "1958 Election Results" (PDF).
- "1960 Election Results" (PDF).
- "1962 Election Results" (PDF).
- "1964 Election Results" (PDF).
- "1966 Election Results" (PDF).
- "1968 Election Results" (PDF).
- "1970 Election Results" (PDF).
- "1972 Election Results" (PDF).
- "1974 Election Results" (PDF).
- "1976 Election Results" (PDF).
- "1978 Election Results" (PDF).
- "1980 Election Results" (PDF).
- "1982 Election Results" (PDF).
- "1984 Election Results" (PDF).
- "1986 Election Results" (PDF).
- "1988 Election Results" (PDF).
- "1990 Election Results" (PDF).
- "1992 Election Results" (PDF).
- "1994 Election Results" (PDF).
- "1996 Election Results" (PDF).
- "1998 Election Results" (PDF).
- "2000 Election Results" (PDF).
- "2002 Election Results" (PDF).
- "2004 Election Results" (PDF).
- "2006 Election Results" (PDF).
- "2008 Election Results" (PDF).
- "2010 Election Results" (PDF).
- "2012 Election Results" (PDF).
- "2014 Election Results". Archived from the original on August 22, 2017. Retrieved August 20, 2017.
- "2016 Election Results". Archived from the original on August 22, 2017. Retrieved August 20, 2017.
- "2018 Colorado general election results". Retrieved June 21, 2019.