Berlin Marzahn – Hellersdorf
Berlin Marzahn – Hellersdorf is one of the 299 single member constituencies used for the German parliament, the Bundestag. Located in East Berlin, the constituency was created for the 1990 election and all elections to date have been won by The Left Party or their predecessors, the Party of Democratic Socialism (PDS).
History and boundaries
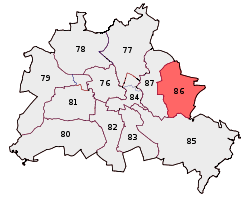
The constituency, numbered constituency 86 by the German electoral authorities,[1] contains the whole of the Berlin borough of Marzahn-Hellersdorf. This borough, a merger of the former boroughs of Marzahn and Hellersdorf, was created by the 2001 administrative reform.
The constituency was created for the 1990 election and the boundaries have been unchanged since then, though a minor name change took place for the 2002 election with the order of areas in the constituency title reversed from the previous "Hellersdorf - Marzahn" to match the name of the new borough.

From 1990 onwards the local MP was Gregor Gysi, then leader of the PDS. For the 2002 election, Petra Pau, MP for the Berlin Mitte - Prenzlauer Berg constituency, which had been abolished in boundary changes, moved to the constituency and was re-elected in 2005 and 2009.
Profile
The number of residents with German citizenship was 96.4%, a figure above the Berlin average of 86.6% and the second highest figure for any Berlin constituency.[2] 27.1% of residents had qualifications which met the requirements for University entry.
Electoral system
Elections in Germany take place using the Additional Member System. Voters have two votes, one for a constituency MP and one for a regional list to elect representatives for the whole of Berlin city. Elections for the Lichtenberg constituency take place using the First past the post system.
Results
2013 election
| 2013 German federal election: Berlin-Marzahn-Hellersdorf[3] | |||||||||
|---|---|---|---|---|---|---|---|---|---|
| Notes: |
Blue background denotes the winner of the electorate vote.
| ||||||||
| Party | Candidate | Votes | % | ±% | Party votes | % | ±% | ||
| Left | 50,866 | 38.9% | 43,026 | 32.9% | |||||
| CDU | 33,552 | 25.7% | 33,947 | 26.0% | |||||
| SPD | 22,341 | 17.1% | 25,103 | 19.2% | |||||
| AfD | 6,347 | 4.9% | 8,319 | 6.4% | |||||
| NPD | 5,540 | 4.2% | 5,101 | 3.9% | |||||
| Green | 4,071 | 3.1% | 5,068 | 3.9% | |||||
| Pirates | 3,668 | 2.8% | 3,996 | 3.1% | |||||
| pro-Deutschland | 1,101 | 0.8% | 1,116 | 0.9% | |||||
| FDP | 938 | 0.7% | 2,278 | 1.7% | |||||
| PARTEI | 860 | 0.7% | 1,114 | 0.9% | |||||
| FW | 717 | 0.5% | 752 | 0.6% | |||||
| Independent | Otto | 499 | 0.4% | ||||||
| BüSo | 239 | 0.2% | 181 | 0.1% | |||||
| REP | 243 | 0.2% | |||||||
| ÖDP | 202 | 0.2% | |||||||
| MLPD | 111 | 0.1% | |||||||
| PSG | 102 | 0.1% | |||||||
| BIG | 73 | 0.1% | |||||||
| Informal votes | 2,078 | 2,085 | |||||||
| Total Valid votes | 130,739 | 130,732 | |||||||
| Left hold | Majority | 17,314 | 13.2% | ||||||
2009 election
| Party | Constituency results | List results | ||||||
|---|---|---|---|---|---|---|---|---|
| Candidate | Votes | % share | +/- | Votes | % share | +/- | ||
| The Left Party.PDS | Petra Pau | 60,236 | 47.7 | +5.0 | 51,662 | 40.8 | +6.4 | |
| Christian Democratic Union | Monika Grütters | 24,563 | 19.4 | +3.3 | 22,875 | 18.2 | +4.0 | |
| Social Democratic Party of Germany | Rudolf Kujath | 20,336 | 16.1 | -13.0 | 20,906 | 16.5 | -17.6 | |
| Alliance '90/The Greens | Stefan Ziller | 7,242 | 5.7 | +2.0 | 8,847 | 7.0 | +1.8 | |
| Free Democratic Party | Klaus Grosse | 6,969 | 5.5 | +2.5 | 9,741 | 7.7 | +2.7 | |
| National Democratic Party of Germany | Matthias Wichmann | 4,725 | 3.7 | 0.0 | 3,832 | 3.0 | -0.2 | |
| Others | 2,330 | 1.8 | N/A | 7,775 | 6.1 | N/A | ||
Out of a total electorate of 203,416, the total number of votes cast was 128,897 (63.4%) of which 2,496 votes were invalid.
Source:[4]
2005 election
| Party | Constituency results | List results | ||||||
|---|---|---|---|---|---|---|---|---|
| Candidate | Votes | % share | +/- | Votes | % share | +/- | ||
| The Left Party.PDS | Petra Pau | 61,845 | 42.6 | +4.9 | 50,042 | 34.4 | +7.1 | |
| Social Democratic Party of Germany | 42,132 | 29.0 | -4.6 | 49,595 | 34.1 | -4.6 | ||
| Christian Democratic Union | 23,459 | 16.2 | -1.9 | 20,499 | 14.1 | -3.6 | ||
| Alliance '90/The Greens | 5,372 | 3.7 | +1.1 | 7,588 | 5.2 | +0.5 | ||
| Free Democratic Party | 4,356 | 3.0 | -0.5 | 7,241 | 5.0 | +0.4 | ||
| National Democratic Party of Germany | 5,428 | 3.7 | +1.1 | 4,634 | 3.2 | +1.6 | ||
| Others | 2,472 | 1.7 | N/A | 1,687 | 1.1 | N/A | ||
Out of a total electorate of 200,926, the total number of votes cast was 147,668 (73.5%) of which 2,604 votes were invalid.
Source:[5]
References
- Election results and statistics (in German) Archived October 31, 2007, at the Wayback Machine
- Constituency data Archived June 16, 2011, at the Wayback Machine
- https://www.bundeswahlleiter.de/en/bundestagswahlen/2013/ergebnisse/bund-99/land-11/wahlkreis-85.html
- "2009 results". Archived from the original on 2009-10-11. Retrieved 2010-02-21.
- 2005 results Archived June 16, 2011, at the Wayback Machine