2001 Northamptonshire County Council election
The 2001 Northamptonshire County Council election took place on 7 June 2001 to elect members of Northamptonshire County Council, England. The whole council was up for election and the Labour Party retained overall control of the council, which it had held since 1993.[2]
| |||||||||||||||||||||
All 73 seats in the Northamptonshire County Council 37 seats needed for a majority | |||||||||||||||||||||
|---|---|---|---|---|---|---|---|---|---|---|---|---|---|---|---|---|---|---|---|---|---|
| |||||||||||||||||||||
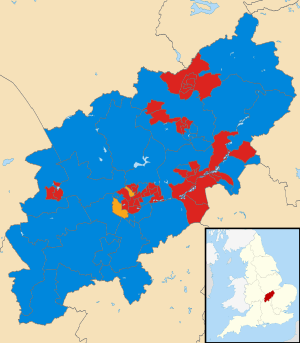 Map showing the results of the 2001 Northamptonshire County Council elections. | |||||||||||||||||||||
| |||||||||||||||||||||
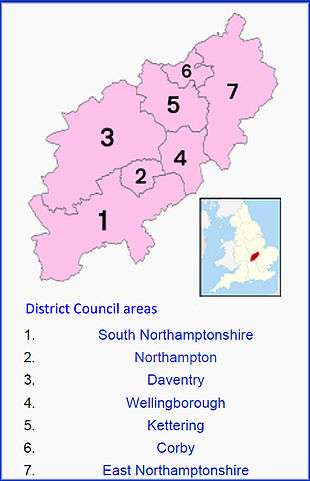
Division by Division Results by County Borough
- In order of number of votes with the winning candidate first
Corby Borough
| Party | Candidate | Votes | % | |
|---|---|---|---|---|
| Labour | M. Bullock | 2,446 | 69.3 | |
| Conservative | R. Tustin | 667 | 18.9 | |
| Liberal Democrats | P. McGowan | 418 | 11.8 | |
| Majority | 1,779 | 50.4 | ||
| Turnout | 3,531 | 57.2 | ||
| Party | Candidate | Votes | % | |
|---|---|---|---|---|
| Labour | J.Wade | 2,523 | 56.6 | |
| Conservative | S. Heggs | 1,938 | 43.4 | |
| Majority | 585 | 13.1 | ||
| Turnout | 4,461 | 65.6 | ||
| Party | Candidate | Votes | % | |
|---|---|---|---|---|
| Labour | J. McKellar | 2,090 | 55.6 | |
| Conservative | B. Howard | 937 | 24.9 | |
| Liberal Democrats | C. Stanbra | 730 | 19.4 | |
| Majority | 1,153 | 30.7 | ||
| Turnout | 3,757 | 60.9 | ||
| Party | Candidate | Votes | % | |
|---|---|---|---|---|
| Labour | A. Bell | 2,659 | 72.6 | |
| Conservative | A. Girvin | 1,002 | 27.4 | |
| Majority | 1,657 | 45.3 | ||
| Turnout | 3,661 | 53.7 | ||
| Party | Candidate | Votes | % | |
|---|---|---|---|---|
| Labour | J. Kane | 3,035 | 73.8 | |
| Conservative | G. Ellenton | 1,075 | 26.2 | |
| Majority | 1,960 | 47.7 | ||
| Turnout | 4,110 | 64.4 | ||
| Party | Candidate | Votes | % | |
|---|---|---|---|---|
| Labour | J. Forshaw | 3,139 | 72.5 | |
| Conservative | C. Woolmer | 1,190 | 27.5 | |
| Majority | 1,949 | 45.0 | ||
| Turnout | 4,329 | 60.6 | ||
Daventry District
| Party | Candidate | Votes | % | |
|---|---|---|---|---|
| Conservative | E. Williams | 2,829 | 58.7 | |
| Labour | K. Ritchie | 1,994 | 41.3 | |
| Majority | 835 | 17.3 | ||
| Turnout | 4,823 | 66.7 | ||
| Party | Candidate | Votes | % | |
|---|---|---|---|---|
| Conservative | J. Millar | 2,632 | 51.9 | |
| Labour | M. Davenport | 1,223 | 24.1 | |
| Liberal Democrats | M. Nice | 1,216 | 24.0 | |
| Majority | 1,409 | 27.8 | ||
| Turnout | 5,071 | 68.5 | ||
| Party | Candidate | Votes | % | |
|---|---|---|---|---|
| Labour | J. Penrose | 2,005 | 53.7 | |
| Conservative | S. Osborne | 1,731 | 46.3 | |
| Majority | 274 | 7.3 | ||
| Turnout | 3,736 | 53.7 | ||
| Party | Candidate | Votes | % | |
|---|---|---|---|---|
| Labour | O. Loud | 2,355 | 60.8 | |
| Conservative | Annette Dunn | 1,521 | 39.2 | |
| Majority | 834 | 21.5 | ||
| Turnout | 3,876 | 51.6 | ||
| Party | Candidate | Votes | % | |
|---|---|---|---|---|
| Conservative | J. Shephard | 2,310 | 55.0 | |
| Labour | M. Hanly | 1,113 | 26.5 | |
| Labour | B. Luck | 774 | 18.4 | |
| Majority | 1,197 | 28.5 | ||
| Turnout | 4,197 | 69.5 | ||
| Party | Candidate | Votes | % | |
|---|---|---|---|---|
| Conservative | A. Tebbutt | 3,004 | 58.2 | |
| Labour | J. Corkill | 1,313 | 25.4 | |
| Green | J. Hurst | 844 | 16.4 | |
| Majority | 1,691 | 32.8 | ||
| Turnout | 5,161 | 71.2 | ||
| Party | Candidate | Votes | % | |
|---|---|---|---|---|
| Conservative | Gina Ogden | 2,531 | 60.5 | |
| Labour | Malcolm Adcock | 1,650 | 39.5 | |
| Majority | 881 | 21.1 | ||
| Turnout | 4,181 | 62.9 | ||
East Northamptonshire District
| Party | Candidate | Votes | % | |
|---|---|---|---|---|
| Conservative | D. Lawson | 2,549 | 55.5 | |
| Labour | A. Dunn | 2,046 | 44.5 | |
| Majority | 503 | 10.9 | ||
| Turnout | 4,595 | 67.3 | ||
| Party | Candidate | Votes | % | |
|---|---|---|---|---|
| Labour | D. Lee | 2,141 | 50.2 | |
| Conservative | S. Hobbs | 2,123 | 49.8 | |
| Majority | 18 | 0.4 | ||
| Turnout | 4,264 | 61.2 | ||
| Party | Candidate | Votes | % | |
|---|---|---|---|---|
| Conservative | C. Reichhold | 2,452 | 51.1 | |
| Labour | J. Brookfield | 1,845 | 38.5 | |
| Independent | J. Smoker | 497 | 10.4 | |
| Majority | 607 | 12.7 | ||
| Turnout | 4,794 | 70.3 | ||
| Party | Candidate | Votes | % | |
|---|---|---|---|---|
| Conservative | P. Padley | 2,920 | 70.3 | |
| Labour | R. Whitehad | 1,233 | 29.7 | |
| Majority | 1,687 | 71.4 | ||
| Turnout | 4,153 | 40.6 | ||
| Party | Candidate | Votes | % | |
|---|---|---|---|---|
| Labour | G. Sharman | 2,011 | 50.9 | |
| Conservative | S. Roberts | 1,937 | 49.1 | |
| Majority | 74 | 1.9 | ||
| Turnout | 3,948 | 61.2 | ||
| Party | Candidate | Votes | % | |
|---|---|---|---|---|
| Labour | L. Cox | 1,703 | 44.0 | |
| Conservative | C. Wood | 1,641 | 42.4 | |
| Liberal Democrats | David Hooton | 529 | 13.7 | |
| Majority | 62 | 1.6 | ||
| Turnout | 3,873 | 56.5 | ||
| Party | Candidate | Votes | % | |
|---|---|---|---|---|
| Conservative | M. Tye | 2,363 | 54.6 | |
| Labour | L. Rolfe | 1,964 | 45.4 | |
| Majority | 399 | 9.2 | ||
| Turnout | 4,327 | 62.7 | ||
| Party | Candidate | Votes | % | |
|---|---|---|---|---|
| Labour | F. Jones | 1,883 | 52.4 | |
| Conservative | R. Pinnock | 1,712 | 47.6 | |
| Majority | 171 | 4.8 | ||
| Turnout | 3,595 | 57.7 | ||
| Party | Candidate | Votes | % | |
|---|---|---|---|---|
| Conservative | B. Seery | 2,529 | 57.1 | |
| Labour | M. Whiteman | 1,578 | 35.6 | |
| UKIP | P. Baden | 322 | 7.3 | |
| Majority | 951 | 21.5 | ||
| Turnout | 4,429 | 67.6 | ||
Kettering Borough
| Party | Candidate | Votes | % | |
|---|---|---|---|---|
| Labour | A. Chambers | 1,784 | 44.2 | |
| Conservative | G. Smith | 1,713 | 42.4 | |
| Liberal Democrats | J. Richardson | 540 | 13.4 | |
| Majority | 71 | 1.8 | ||
| Turnout | 4,037 | 69.9 | ||
| Party | Candidate | Votes | % | |
|---|---|---|---|---|
| Conservative | C. Lamb | 1,709 | 38.9 | |
| Labour | A. Gordon | 1,657 | 37.7 | |
| Liberal Democrats | K. Simons | 1,026 | 23.4 | |
| Majority | 52 | 1.2 | ||
| Turnout | 4,392 | 67.0 | ||
| Party | Candidate | Votes | % | |
|---|---|---|---|---|
| Labour | D. Coe | 2,079 | 47.9 | |
| Conservative | B. Glynane | 1,861 | 42.9 | |
| Liberal Democrats | M. Hill | 401 | 9.2 | |
| Majority | 218 | 5.0 | ||
| Turnout | 4,341 | 69.7 | ||
| Party | Candidate | Votes | % | |
|---|---|---|---|---|
| Labour | R. Mayhew | 2,095 | 62.6 | |
| Conservative | K. Marsh | 911 | 27.2 | |
| Liberal Democrats | F. Peacock | 340 | 10.2 | |
| Majority | 1,184 | 35.4 | ||
| Turnout | 3,346 | 58.9 | ||
| Party | Candidate | Votes | % | |
|---|---|---|---|---|
| Conservative | R. Baker | 1,824 | 43.1 | |
| Labour | G. Marshall | 1,806 | 42.7 | |
| Liberal Democrats | V. McGlynn | 604 | 14.3 | |
| Majority | 18 | 0.4 | ||
| Turnout | 4,234 | 67.9 | ||
| Party | Candidate | Votes | % | |
|---|---|---|---|---|
| Labour | I. Watts | 2,153 | 52.9 | |
| Conservative | J. Harker | 1,372 | 33.7 | |
| Liberal Democrats | C. McGlynn | 543 | 13.3 | |
| Majority | 781 | 19.2 | ||
| Turnout | 4,068 | 60.8 | ||
| Party | Candidate | Votes | % | |
|---|---|---|---|---|
| Conservative | J. Harker | 3,015 | 56.6 | |
| Labour | R. Smith | 1,553 | 29.2 | |
| Liberal Democrats | J. Prentice | 755 | 14.2 | |
| Majority | 1,461 | 27.5 | ||
| Turnout | 5,323 | 74.9 | ||
| Party | Candidate | Votes | % | |
|---|---|---|---|---|
| Labour | D. Whyte | 1,996 | 53.9 | |
| Conservative | M. Spendlove | 1,704 | 46.1 | |
| Majority | 292 | 7.9 | ||
| Turnout | 3,700 | 66.8 | ||
| Party | Candidate | Votes | % | |
|---|---|---|---|---|
| Labour | J. West | 2,285 | 55.2 | |
| Conservative | T. Freer | 1,858 | 44.8 | |
| Majority | 427 | 10.3 | ||
| Turnout | 4,143 | 59.9 | ||
| Party | Candidate | Votes | % | |
|---|---|---|---|---|
| Conservative | W. Parker | 1,917 | 40.2 | |
| Labour | J. Connolly | 1,851 | 38.8 | |
| Liberal Democrats | J. Coleman | 1,000 | 21.0 | |
| Majority | 66 | 1.4 | ||
| Turnout | 4,768 | 68.4 | ||
Northampton Borough
| Party | Candidate | Votes | % | |
|---|---|---|---|---|
| Labour | M. Boss | 1,780 | 49.7 | |
| Conservative | J. Ashby | 965 | 26.9 | |
| Liberal Democrats | C. Markham | 839 | 23.4 | |
| Majority | 815 | 22.7 | ||
| Turnout | 3,584 | 56.0 | ||
| Party | Candidate | Votes | % | |
|---|---|---|---|---|
| Labour | W. Strachan | 1,500 | 43.6 | |
| Conservative | J. Duncan | 1,377 | 40.0 | |
| Liberal Democrats | L. Felstead | 566 | 16.4 | |
| Majority | 123 | 3.6 | ||
| Turnout | 3,443 | 51.8 | ||
| Party | Candidate | Votes | % | |
|---|---|---|---|---|
| Labour | B. Kirby | 1,661 | 39.2 | |
| Conservative | I. McCann | 1,298 | 30.6 | |
| Liberal Democrats | J. Yates | 1,282 | 30.2 | |
| Majority | 363 | 8.6 | ||
| Turnout | 4,241 | 62.6 | ||
| Party | Candidate | Votes | % | |
|---|---|---|---|---|
| Labour | R. Dickie | 2,023 | 60.8 | |
| Conservative | E. Barham | 677 | 20.3 | |
| Liberal Democrats | G. Bowles | 528 | 15.9 | |
| Independent | P. Harrisson | 100 | 3.0 | |
| Majority | 1,346 | 40.4 | ||
| Turnout | 3,328 | 47.6 | ||
| Party | Candidate | Votes | % | |
|---|---|---|---|---|
| Labour | C. Kalyan | 1,591 | 46.7 | |
| Liberal Democrats | B. Glynane | 923 | 27.1 | |
| Conservative | M. Hill | 893 | 26.2 | |
| Majority | 668 | 19.6 | ||
| Turnout | 3,407 | 55.5 | ||
| Party | Candidate | Votes | % | |
|---|---|---|---|---|
| Labour | M. Thomas | 2,007 | 50.9 | |
| Conservative | L. Percival | 1,205 | 30.6 | |
| Liberal Democrats | B. Dee | 728 | 18.5 | |
| Majority | 802 | 20.4 | ||
| Turnout | 2,855 | 58.4 | ||
| Party | Candidate | Votes | % | |
|---|---|---|---|---|
| Conservative | J. Nunn | 1,789 | 46.7 | |
| Labour | T. Bailey | 1,343 | 35.0 | |
| Liberal Democrats | S. Battison | 700 | 18.3 | |
| Majority | 446 | 11.6 | ||
| Turnout | 3,832 | 57.8 | ||
| Party | Candidate | Votes | % | |
|---|---|---|---|---|
| Labour | P. Concannon | 1,331 | 45.5 | |
| Conservative | J. Lane | 1,124 | 38.4 | |
| Liberal Democrats | R. Baldwin | 641 | 16.0 | |
| Majority | 207 | 7.1 | ||
| Turnout | 2,964 | 54.1 | ||
| Party | Candidate | Votes | % | |
|---|---|---|---|---|
| Labour | V. Dams | 1,562 | 35.9 | |
| Conservative | G. Hawker | 1,440 | 33.1 | |
| Liberal Democrats | S. Hope | 1,349 | 31.0 | |
| Majority | 122 | 2.8 | ||
| Turnout | 4,351 | 66.8 | ||
| Party | Candidate | Votes | % | |
|---|---|---|---|---|
| Labour | J. Dixon | 1,592 | 40.4 | |
| Liberal Democrats | R. Church | 1,517 | 38.5 | |
| Conservative | G. Austin | 829 | 21.1 | |
| Majority | 75 | 1.9 | ||
| Turnout | 3,938 | 55.6 | ||
| Party | Candidate | Votes | % | |
|---|---|---|---|---|
| Liberal Democrats | S. Beardsworth | 1,844 | 45.2 | |
| Labour | F. Wire | 1,397 | 34.2 | |
| Conservative | M. Miah | 840 | 20.6 | |
| Majority | 447 | 11.0 | ||
| Turnout | 4,081 | 59.6 | ||
| Party | Candidate | Votes | % | |
|---|---|---|---|---|
| Labour | M. Young | 1,618 | 55.9 | |
| Conservative | B. Eldred | 782 | 27.0 | |
| Liberal Democrats | M. Taylor | 492 | 17.0 | |
| Majority | 836 | 28.9 | ||
| Turnout | 2,892 | 47.6 | ||
| Party | Candidate | Votes | % | |
|---|---|---|---|---|
| Conservative | C. Lill | 2,208 | 52.5 | |
| Labour | J. Lineker | 1,288 | 30.6 | |
| Liberal Democrats | R. Matthews | 711 | 16.9 | |
| Majority | 920 | 21.9 | ||
| Turnout | 4,207 | 66.3 | ||
| Party | Candidate | Votes | % | |
|---|---|---|---|---|
| Conservative | E. Tavener | 1,958 | 46.6 | |
| Labour | P. Evans | 1,638 | 39.0 | |
| Liberal Democrats | R. Cant | 608 | 14.5 | |
| Majority | 320 | 7.6 | ||
| Turnout | 4,204 | 64.0 | ||
| Party | Candidate | Votes | % | |
|---|---|---|---|---|
| Conservative | D. Edwards | 1,802 | 44.0 | |
| Labour | A. Kingston | 1,756 | 42.9 | |
| Liberal Democrats | C. Squires | 536 | 13.1 | |
| Majority | 46 | 1.1 | ||
| Turnout | 4,094 | 63.6 | ||
| Party | Candidate | Votes | % | |
|---|---|---|---|---|
| Conservative | W. Massey | 1,733 | 41.4 | |
| Labour | F. Lilley | 1,685 | 40.3 | |
| Liberal Democrats | I. Wright | 767 | 18.3 | |
| Majority | 48 | 1.1 | ||
| Turnout | 4,185 | 66.9 | ||
| Party | Candidate | Votes | % | |
|---|---|---|---|---|
| Labour | J. Bains | 1,696 | 59.4 | |
| Conservative | B. Wright | 694 | 24.3 | |
| Liberal Democrats | I. Markham | 465 | 16.3 | |
| Majority | 1,002 | 35.1 | ||
| Turnout | 2,855 | 47.4 | ||
| Party | Candidate | Votes | % | |
|---|---|---|---|---|
| Labour | A. McCutcheon | 1,545 | 51.0 | |
| Conservative | D. Clark | 864 | 28.5 | |
| Liberal Democrats | M. Hoare | 535 | 17.7 | |
| Independent | T. Harvey | 83 | 2.7 | |
| Majority | 681 | 22.5 | ||
| Turnout | 3,007 | 47.9 | ||
| Party | Candidate | Votes | % | |
|---|---|---|---|---|
| Labour | J. Gardner | 1,530 | 47.0 | |
| Liberal Democrats | N. Felstead | 967 | 29.7 | |
| Conservative | J. Cartwright | 757 | 23.3 | |
| Majority | 563 | 17.3 | ||
| Turnout | 3,254 | 48.1 | ||
| Party | Candidate | Votes | % | |
|---|---|---|---|---|
| Labour | T. Wire | 1,805 | 52.0 | |
| Conservative | A. Wright | 1,157 | 33.4 | |
| Liberal Democrats | M. Minney | 506 | 14.6 | |
| Majority | 648 | 18.7 | ||
| Turnout | 3,468 | 54.2 | ||
| Party | Candidate | Votes | % | |
|---|---|---|---|---|
| Labour | L. Patterson | 1,550 | 55.0 | |
| Conservative | J. Cartwright | 858 | 30.5 | |
| Liberal Democrats | M. Taylor | 408 | 14.5 | |
| Majority | 692 | 24.6 | ||
| Turnout | 2,816 | 49.9 | ||
| Party | Candidate | Votes | % | |
|---|---|---|---|---|
| Conservative | C. Hugheston-Roberts | 1,367 | 39.7 | |
| Liberal Democrats | J. Hope | 1,044 | 30.3 | |
| Labour | U. Gravesande | 886 | 25.7 | |
| UKIP | D. Clark | 146 | 4.2 | |
| Majority | 323 | 9.4 | ||
| Turnout | 3,443 | 62.0 | ||
| Party | Candidate | Votes | % | |
|---|---|---|---|---|
| Conservative | M. Hill | 2,437 | 51.4 | |
| Labour | M. Cleaves | 1,485 | 31.3 | |
| Liberal Democrats | J. Cramp | 815 | 17.2 | |
| Majority | 952 | 20.1 | ||
| Turnout | 4,737 | 68.9 | ||
South Northamptonshire District
| Party | Candidate | Votes | % | |
|---|---|---|---|---|
| Conservative | J. Shepherd-Cross | 2,578 | 56.4 | |
| Labour | P. Sceeny | 1,994 | 43.6 | |
| Majority | 584 | 12.8 | ||
| Turnout | 4,572 | 61.0 | ||
| Party | Candidate | Votes | % | |
|---|---|---|---|---|
| Conservative | R. Sawbridge | 2,056 | 50.4 | |
| Liberal Democrats | I. Franklin | 1,094 | 26.8 | |
| Labour | G. Youens | 931 | 22.8 | |
| Majority | 962 | 23.6 | ||
| Turnout | 4,081 | 66.1 | ||
| Party | Candidate | Votes | % | |
|---|---|---|---|---|
| Conservative | J. Kirkbride | 2,680 | 59.4 | |
| Labour | R. Johnson | 944 | 20.9 | |
| Liberal Democrats | S. Pace | 887 | 19.7 | |
| Majority | 1,736 | 38.5 | ||
| Turnout | 4,511 | 70.8 | ||
| Party | Candidate | Votes | % | |
|---|---|---|---|---|
| Conservative | A. Walker | 2,526 | 57.2 | |
| Labour | V. Whitaker | 1,892 | 42.8 | |
| Majority | 634 | 14.4 | ||
| Turnout | 4,418 | 69.1 | ||
| Party | Candidate | Votes | % | |
|---|---|---|---|---|
| Conservative | B. Smith | 3,301 | 67.6 | |
| Labour | D. Wardle | 1,582 | 32.4 | |
| Majority | 1,719 | 35.2 | ||
| Turnout | 4,883 | 70.9 | ||
| Party | Candidate | Votes | % | |
|---|---|---|---|---|
| Conservative | B. Binley | 2,811 | 61.0 | |
| Labour | R. Foot | 1,171 | 25.4 | |
| Liberal Democrats | A. Simpson | 627 | 13.6 | |
| Majority | 1,640 | 35.6 | ||
| Turnout | 4,609 | 71.3 | ||
| Party | Candidate | Votes | % | |
|---|---|---|---|---|
| Conservative | M. Mildren | 2,771 | 57.5 | |
| Labour | C. Fitchett | 2,046 | 42.5 | |
| Majority | 725 | 15.1 | ||
| Turnout | 4,871 | 66.0 | ||
| Party | Candidate | Votes | % | |
|---|---|---|---|---|
| Conservative | D. Batten | 2,075 | 51.7 | |
| Labour | W. Toone | 1,245 | 31.0 | |
| Liberal Democrats | S. O'Connor | 693 | 17.3 | |
| Majority | 830 | 20.7 | ||
| Turnout | 4,043 | 70.2 | ||
| Party | Candidate | Votes | % | |
|---|---|---|---|---|
| Conservative | R. Bromwich | 2,018 | 49.4 | |
| Liberal Democrats | J. Calder | 1,048 | 25.6 | |
| Labour | H. Kerr | 1,022 | 25.0 | |
| Majority | 970 | 23.7 | ||
| Turnout | 4,088 | 64.6 | ||
Wellingborough Borough
| Party | Candidate | Votes | % | |
|---|---|---|---|---|
| Labour | A. Simon | 2,282 | 50.5 | |
| Conservative | C. Benham | 1,624 | 35.9 | |
| Liberal Democrats | P. Gaskell | 613 | 13.6 | |
| Majority | 658 | 14.6 | ||
| Turnout | 4,519 | 58.4 | ||
| Party | Candidate | Votes | % | |
|---|---|---|---|---|
| Labour | G. Blackwell | 2,900 | 56.0 | |
| Conservative | P. Bell | 2,275 | 44.0 | |
| Majority | 625 | 12.1 | ||
| Turnout | 5,175 | 72.6 | ||
| Party | Candidate | Votes | % | |
|---|---|---|---|---|
| Conservative | J. Bailey | 2,809 | 56.6 | |
| Labour | L. Warner | 1,504 | 30.3 | |
| Liberal Democrats | W. Urmson | 651 | 13.1 | |
| Majority | 1,305 | 26.3 | ||
| Turnout | 4,964 | 71.4 | ||
| Party | Candidate | Votes | % | |
|---|---|---|---|---|
| Labour | J. Ashton | 2,274 | 54.6 | |
| Conservative | Y. Miles | 1,892 | 45.4 | |
| Majority | 382 | 9.2 | ||
| Turnout | 4,166 | 64.1 | ||
| Party | Candidate | Votes | % | |
|---|---|---|---|---|
| Labour | T. Maguire | 1,989 | 44.6 | |
| Conservative | J. Saxby | 1,922 | 43.1 | |
| Liberal Democrats | K. Clements | 550 | 12.3 | |
| Majority | 57 | 1.5 | ||
| Turnout | 4,461 | 71.2 | ||
| Party | Candidate | Votes | % | |
|---|---|---|---|---|
| Labour | P. Jones | 2,115 | 56.6 | |
| Conservative | V. Ager | 1,230 | 32.9 | |
| Liberal Democrats | P. Thornborow | 395 | 10.6 | |
| Majority | 885 | 23.7 | ||
| Turnout | 3,740 | 58.3 | ||
c
| Party | Candidate | Votes | % | |
|---|---|---|---|---|
| Conservative | M. Waters | 2,036 | 48.5 | |
| Labour | J. Robinson | 1,488 | 35.4 | |
| Liberal Democrats | P. Wilkins | 674 | 16.1 | |
| Majority | 548 | 13.1 | ||
| Turnout | 4,198 | 69.0 | ||
| Party | Candidate | Votes | % | |
|---|---|---|---|---|
| Labour | P. Cass | 2,220 | 53.4 | |
| Conservative | J. Read | 1,935 | 46.6 | |
| Majority | 285 | 6.9 | ||
| Turnout | 4,155 | 64.8 | ||
gollark: Anyway, threads and the various synchronization primitives in C (or, well, commonly used with C?) are not a particularly good model for concurrency given the many, many bugs created through use of such things, as opposed to actor models and whatever.
gollark: What? That makes no sense.
gollark: Yes, but there's no performance benefit, you can just run multiple programs.
gollark: https://queue.acm.org/detail.cfm?id=3212479
gollark: AMD and Intel CPUs have for some time been JITing x86 into internal RISC microcode.
References
- "Local Election Summaries 2001". The Elections Centre. Retrieved 24 June 2019.
- Northamptonshire County Council Election Results 1973-2009
| Northamptonshire County Council | |
|---|---|
| Corby Borough Council | |
| Daventry District Council | |
| East Northamptonshire District Council | |
| Kettering Borough Council | |
| Northampton Borough Council | |
| South Northamptonshire District Council |
|
| Wellingborough Borough Council | |
| |
| County councils |
|
|---|---|
| Unitary authorities |
|
| District councils (Northern Ireland) |
|
| Sui generis |
|
| |
This article is issued from Wikipedia. The text is licensed under Creative Commons - Attribution - Sharealike. Additional terms may apply for the media files.