2001 Cape Verdean parliamentary election
Parliamentary elections were held in Cape Verde on 14 January 2001. The result was a victory for the African Party for the Independence of Cape Verde run by José Maria Neves, which won 40 of the 72 seats in the National Assembly,[1][2] defeating the ruling Movement for Democracy led by Carlos Veiga. Third was the Democratic Alliance for Change (ADM) led by José dos Santos Luís with 6.12% of the votes.
| |||||||||||||||||||||||||||||
| Registered | 260,126 | ||||||||||||||||||||||||||||
|---|---|---|---|---|---|---|---|---|---|---|---|---|---|---|---|---|---|---|---|---|---|---|---|---|---|---|---|---|---|
| Turnout | 55.53% | ||||||||||||||||||||||||||||
| |||||||||||||||||||||||||||||
| |||||||||||||||||||||||||||||

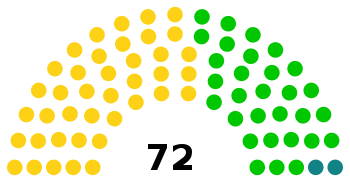
Seats of the National Assembly after the 2001 parliamentary election
 |
|---|
| This article is part of a series on the politics and government of Cape Verde |
|
Legislature |
|
Judiciary
|
|
|
Results
| Party | Votes | % | Seats | +/– |
|---|---|---|---|---|
| African Party for the Independence of Cape Verde | 67,860 | 49.50 | 40 | +19 |
| Movement for Democracy | 55,586 | 40.55 | 30 | –20 |
| Democratic Alliance for Change | 8,389 | 6.12 | 2 | +1 |
| Democratic Renewal Party | 4,630 | 3.38 | 0 | New |
| Social Democratic Party | 620 | 0.45 | 0 | 0 |
| Invalid/blank votes | 4,751 | – | – | – |
| Total | 141,836 | 100 | 72 | 0 |
| Registered voters/turnout | 260,126 | 55.53 | – | – |
| Source: African Elections Database | ||||
gollark: As previously stated, you've made precisely 0 Macron implementations.
gollark: So would your borrow checker.
gollark: Go through the content of the referrer in some way and delete things which are the referent.
gollark: Well, if you want one owner, then randomly pick one referrer to keep the data and erase it from the others.
gollark: And I meant why not go back there.
References
- Elections in Cape Verde African Elections Database
- "Cape Verde president 'wins' poll". BBC News.
External links
- National Elections Commission (in Portuguese)
This article is issued from Wikipedia. The text is licensed under Creative Commons - Attribution - Sharealike. Additional terms may apply for the media files.