1995 Cape Verdean parliamentary election
Parliamentary elections were held in Cape Verde on 17 December 1995. The number of seats was reduced from 79 to 72. The result was a victory for the ruling Movement for Democracy, which won 50 of the 72 seats.[1] Voter turnout was 76.52%.[2]
| |||||||||||||||||||||||||||||
| Registered | 207,648 | ||||||||||||||||||||||||||||
|---|---|---|---|---|---|---|---|---|---|---|---|---|---|---|---|---|---|---|---|---|---|---|---|---|---|---|---|---|---|
| Turnout | 76.52% | ||||||||||||||||||||||||||||
| |||||||||||||||||||||||||||||
| |||||||||||||||||||||||||||||

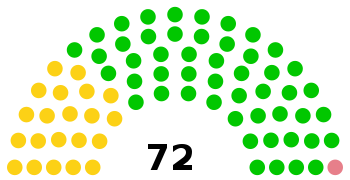
Seats of the National Assembly after the 1995 parilamentary election
 |
|---|
| This article is part of a series on the politics and government of Cape Verde |
|
Legislature |
|
Judiciary
|
|
|
Results
| Party | Votes | % | Seats | +/– |
|---|---|---|---|---|
| Movement for Democracy | 93,249 | 61.30 | 50 | –6 |
| African Party for the Independence of Cape Verde | 45,263 | 29.75 | 21 | –2 |
| Democratic Convergence Party | 10,211 | 6.71 | 1 | New |
| Democratic and Independent Cape Verdean Union | 2,369 | 1.54 | 0 | New |
| Social Democratic Party | 1,030 | 0.67 | 0 | New |
| Invalid/blank votes | 5,474 | – | – | – |
| Total | 158,901 | 100 | 72 | –7 |
| Registered voters/turnout | 207,648 | 76.52 | – | – |
| Source: African Elections Database | ||||
gollark: <@160279332454006795> I am everywhere. None can escape.
gollark: I WILL CONSUME YOUR SOUL.
gollark: 1.12.2 with mods would be best.
gollark: <@319753218592866315> no pingy.
gollark: I do sort of prefer Arch, so I may be migrating the osmarks.tk server to that.
References
- Elections in Cape Verde African Elections Database
- Cape Verde: Parliamentary Chamber: Assembleia Nacional: Elections held in 1991 Inter-Parliamentary Union
This article is issued from Wikipedia. The text is licensed under Creative Commons - Attribution - Sharealike. Additional terms may apply for the media files.