1994 North American cold wave
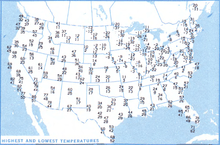
The 1994 North American cold wave occurred over the midwestern United States, eastern United States, and southern Canada during January 1994. Two notable cold air events occurred from January 18–19 and from January 21–22. There were 67 minimum temperature records set on January 19.[1] Indiana and Kentucky both set state records on January 19.[2] The United States experienced its coldest temperature month since February 1934, although much of the West experienced mild temperatures. Washington and Idaho experienced the second-warmest January recorded in the previous 100 years.[1]
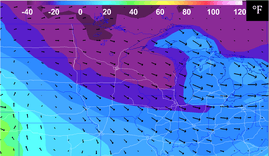
 MERRA-2 Reanalysis over the Upper Midwest showing 2-Meter Temperatures and wind vectors on January 18, 1994, at 1 PM EST. Temperatures are in Fahrenheit. | |
| Type | Cold wave |
|---|---|
| Formed | January 1994 |
| Dissipated | January 1994 |
| Lowest temperature | -52 °F (-46.7 °C) in Amasa, MI on January 19 |
| Areas affected | United States and Canada |
The eastern United States experienced a major snowfall that significantly delayed traffic.[3]
Over 100 deaths occurred in the United States as a result of the cold wave.
Meteorological synopsis

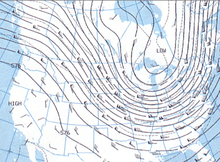
Cold air outbreaks are characterized by strong upper-level troughs in the atmosphere, with ridges usually located up and downstream.[4] On January 17, the 500 millibar (mb) height contours showed the low-pressure center situated near the border of Ontario and Manitoba, just north of Minnesota, with the trough axis stretching down into the Upper Midwest. The 500 mb height contours on January 18, 1994, showed the strong trough over the Great Lakes region extending southward that brought cold air down from the North Pole. MERRA-2 reanalysis detailed the cold air funneling into the Upper Midwest from Canada on January 18, with strong winds out of the northwest. The surface analysis map on January 18 showed a low-level ridge over the Upper Midwest and surface winds blowing out of the northwest. The surface anticyclones on January 18 and 21 both exceeded 1040 mb and moved to the southeast, bringing cold air to much of the eastern half of the United States. By January 19, the upper levels showed a retreat of the low-pressure center, however, shortwave troughs were still located near the United States, and surface temperature effects with the strong anticyclone were felt for days to come.[5]
While the cold air was the dominant story, snow was still associated with this cold weather outbreak. From January 17–18, a snowstorm affected areas from the Ozarks to New England. Ice affected much of the Mid-Atlantic region. A new single-storm record was broken in Louisville, Kentucky with 16 inches of snowfall recorded, while accumulations of sleet and freezing rain in New York City were in excess of an inch.[1]

Temperature records

On January 16, the Watertown, NY, International Airport set an all-time record low of -43 °F (-41.7 °C.)[6]
The city of Watertown, NY, observed its coldest January on record, (since 1893,) with a mean temperature of 5.39 °F (-14.78 °C.)[7]
Syracuse New York's Hancock International Airport recorded a monthly mean temperature of 12.6 °F (-10.8 °C,) a record low for January.[8]
Washington National Airport, later renamed to Ronald Reagan Washington National Airport, had a new record-low max. temperature for the 20th century of 8 °F (−13.3 °C).[9][10]
Cincinnati, Ohio reached a temperature of −24 °F (−31.1 °C), just one degree short of the record. Columbus, Ohio saw a record −22 °F (−30.0 °C),[11] and Cleveland, Ohio reached a record of −20 °F (−28.9 °C). Erie, Pennsylvania hit −18 °F (−27.8 °C), which at the time was a record.
On January 19, the temperature in New Whiteland, Indiana dropped to −36 °F (−37.8 °C), the record-lowest temperature in Indiana.[12] The minimum record temperature in Kentucky was −37 °F (−38.3 °C) in Shelbyville on January 19, 1994.[13]
The lowest temperature seen in Sussex County, New Jersey was −26 °F (−32.2 °C) on January 21, 1994.[14]:p.3
Pittsburgh, Pennsylvania saw its record-low temperature of −22 °F (−30 °C) on January 19, 1994.[15] Columbus, Ohio set an all-time record-low temperature of −22 °F (−30 °C) on January 19 as well. However, the arctic blast lasted for three days from January 18 to 20.[16]
Akron, Ohio set a record-low temperature at −25 °F (−32 °C).[1]
On January 6–7, 1994, Lake County, Minnesota set records for the largest snow in one day as well as the most snow in one storm.[17]
Maine had its coldest month since February 1934[18] and its coldest January since 1920,[19] while Vermont had its coldest winter since 1958–1959[20] and the adjacent states of New Hampshire and Maine their coldest since 1976–1977 or 1970–1971.
Canada
January was also a month of extremes in Canada. Temperatures in the Yukon got close to −50 °C (−58 °F). In Yellowknife, the temperature did not go higher than −40 °C (−40 °F) for many days. In Windsor, Ontario, the coldest temperature since 1885 was recorded on January 19 with −29 °C (−20 °F). On January 16th, Scarborough, Ontario, recorded an all-time record low temperature of −35.2 °C (−31.4 °F),[21] several degrees colder than the official coldest record for Toronto,[22] which Scarborough is now a part of. The city of Toronto itself dropped to −31 °C (−24 °F), but recorded its coldest January on record with −12.4 °C (9.7 °F) at the airport. The cold air was also accompanied by large snowfalls, with 50 centimeters (20 inches) falling on the western side of Lake Ontario. Just like the mild pattern in the western United States, southern British Columbia got above 10 °C (50 °F) several times during the month of January. Rapid melting and freezing near the end of the January closed Toronto Pearson International Airport on January 30 for the first time in 60 years. Water shortages were also common in Goose Bay due to the extreme temperatures.[1]
Minneapolis–St. Paul

Minneapolis–Saint Paul is one of the areas that felt major impacts from the cold wave. From 3 PM CST on January 13 to 1 PM CST on January 19, the temperature recorded at Minneapolis–Saint Paul International Airport stayed at or below zero, marking 142 continuous hours. This was the sixth-longest stretch on record from 1873–2014.[23] Governor Arne Carlson closed all public schools in Minnesota on January 18, with wind chills of −48 °F (−44 °C) and morning air temperatures of −26 °F (−32 °C).[24]
Chicago
Temperatures in Chicago, Illinois reached −21 °F (−29.4 °C)[3] with wind chills of around −70 °F (−56.7 °C),[25] the coldest day of the 1990s in Chicago.[26] Almost all primary and secondary schools in Chicago were closed that day. Richard Daley, mayor of Chicago advised residents not to go outside if they do not have to. Nearly all schools in the area were closed and four people in Cook County, Illinois died from hypothermia. Hundreds of drivers per hour complained to the AAA-Chicago Motor Club about dead automobile batteries, fuel injectors being too cold and other vehicle issues and United Airlines canceled almost half of its flights. Tens of thousands of individuals complained about a lack of power due to severed electricity lines while water companies shut off water to homes as a result of pipe explosions.[25] Thousands of apartment renters complained to Cook County about insufficient heat.
References
- Ludlum, David M. (1994-05-01). "January 1994". Weatherwise. 47 (2): 44–49. doi:10.1080/00431672.1994.9925321. ISSN 0043-1672.
- Schmidlin, Thomas W. (1997-01-01). <0035:RSMTRI>2.0.CO;2 "Recent State Minimum Temperature Records in the Midwest". Bulletin of the American Meteorological Society. 78 (1): 35–40. Bibcode:1997BAMS...78...35S. doi:10.1175/1520-0477(1997)078<0035:RSMTRI>2.0.CO;2. ISSN 0003-0007.
- "Chicagoans Endure New Record Cold – Chicago Tribune". Articles.chicagotribune.com. 1994-01-18. Retrieved 2013-10-17.
- "Winter Weather Basics: Cold Air Outbreaks" (PDF).
- "U.S. Daily Weather Maps | NOAA Central Library". www.lib.noaa.gov. Archived from the original on 2017-04-29. Retrieved 2017-05-04.
- "National Climatic Data Center (NCDC)", Van Nostrand's Scientific Encyclopedia, John Wiley & Sons, Inc., 2006-11-17, doi:10.1002/0471743984.vse8648, ISBN 0471743984
- Prono, Luca (2012), "Western Regional Climate Center", Encyclopedia of Global Warming & Climate Change, SAGE Publications, Inc., doi:10.4135/9781452218564.n751, ISBN 9781412992619
- US Department of Commerce, NOAA. "Daily Records for Syracuse, NY". www.weather.gov. Retrieved 2019-03-11.
- Rick Grow (2013-01-19). "Recalling the January 1994 Arctic Outbreak – The Frederick News-Post : Free State Weather". The Frederick News-Post. Retrieved 2013-10-17.
- NOAA National Climate Data Center. "Daily Summaries Station Details: WASHINGTON REAGAN NATIONAL AIRPORT, VA US". Retrieved 2013-11-04.
- Meckler, Michael. "25 years ago today: Coldest day ever recorded in Columbus at -22 degrees". The Columbus Dispatch. Retrieved 2019-01-19.
- "Indiana State Climate Office". Climate.agry.purdue.edu. Archived from the original on 2013-10-19. Retrieved 2013-10-18.
- "Winter Climatology". Crh.noaa.gov. Retrieved 2013-10-18.
- U.S. Department of Agriculture Natural Resource Conservation Service. Soil Survey of Sussex County, New Jersey (Washington, DC: 2009).
- "Brrrr! Remembering Pittsburgh's coldest day | Weather – WTAE Home". Wtae.com. 2013-01-19. Archived from the original on 2013-10-18. Retrieved 2013-10-18.
- "Records for Columbus". Archived from the original on December 21, 2014. Retrieved January 6, 2015.
- "Minnesota Snowfall and Snow Depth Extremes". National Climatic Data Center. December 3, 2007. Retrieved 2008-02-01.
- "Climate at a Glance | National Centers for Environmental Information (NCEI)". Ncdc.noaa.gov. 2015-03-06. Retrieved 2016-02-08.
- "Climate at a Glance | National Centers for Environmental Information (NCEI)". Ncdc.noaa.gov. 2015-03-06. Retrieved 2016-02-08.
- "Climate at a Glance | National Centers for Environmental Information (NCEI)". Ncdc.noaa.gov. 2015-03-06. Retrieved 2016-02-08.
- "Statistics: Scarborough, Ontario - the Weather Network".
- "Statistics".
- "Extended Period of Zero or Below in the Twin Cities 1873–2014". www.climate.umn.edu. Retrieved 2017-05-03.
- "Historic Wind Chill Temperatures in Minnesota". climate.umn.edu. Retrieved 2017-05-03.
- "Cold, Colder And Maybe The Coldest – Chicago Tribune". Articles.chicagotribune.com. 1994-01-18. Retrieved 2013-10-18.
- "Coldest Days Ever In Chicago « CBS Chicago". Chicago.cbslocal.com. 2011-02-10. Retrieved 2013-10-17.