1992 City of Edinburgh District Council election
Elections to the City of Edinburgh District Council took place in May 1992, alongside elections to the councils of Scotland's various other districts.
| |||||||||||||||||||||||||||||||||||||||||||||||
All 62 seats to Edinburgh City Council 32 seats needed for a majority | |||||||||||||||||||||||||||||||||||||||||||||||
|---|---|---|---|---|---|---|---|---|---|---|---|---|---|---|---|---|---|---|---|---|---|---|---|---|---|---|---|---|---|---|---|---|---|---|---|---|---|---|---|---|---|---|---|---|---|---|---|
| |||||||||||||||||||||||||||||||||||||||||||||||
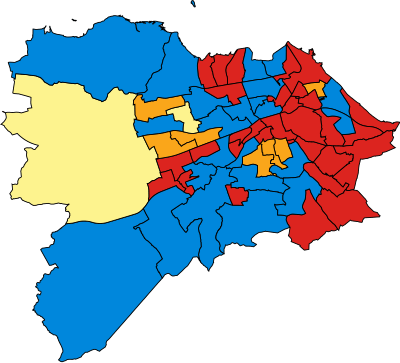
 Map showing results in Edinburgh District Council wards | |||||||||||||||||||||||||||||||||||||||||||||||
| |||||||||||||||||||||||||||||||||||||||||||||||
Labour, which had won control of the Council for the first time ever in the 1984 election, lost overall control but managed to remain the largest party on the council despite losing the popular vote amid a swing to the Conservatives in the city. The Liberal Democrats were able to capture several new seats in the centre of the city, including Marchmont, Morningside, and Sciennes. Voter turnout was 48.2%, down 5% from the previous elections.
Aggregate results

The result of the election
| Party | Seats | Gains | Losses | Net gain/loss | Seats % | Votes % | Votes | +/− | |
|---|---|---|---|---|---|---|---|---|---|
| Labour | 30 | 0 | 3 | 29.2 | 48,756 | ||||
| Conservative | 23 | 3 | 3 | 40.2 | 67,266 | ||||
| Liberal Democrats | 7 | 3 | 0 | 15.4 | 25,775 | ||||
| SNP | 2 | 1 | 1 | 14.4 | 24,087 | ||||
| Scottish Green | 0 | 0.8 | 1,219 | ||||||
| Other parties | 0 | 0.3 | 399 | ||||||
gollark: Increasing Haskell incursions threaten the fabric of reality.
gollark: This is greatly worrying.
gollark: Is firecubez unironically xmonad?!
gollark: https://github.com/ytdl-org/youtube-dl/issues/2165
gollark: Yes, youtube-dl magically all videos.
References
This article is issued from Wikipedia. The text is licensed under Creative Commons - Attribution - Sharealike. Additional terms may apply for the media files.