1961 Pacific typhoon season
The 1961 Pacific typhoon season had no official bounds; it ran year-round in 1961, but most tropical cyclones tend to form in the northwestern Pacific Ocean between June and December. These dates conventionally delimit the period of each year when most tropical cyclones form in the northwestern Pacific Ocean.
| 1961 Pacific typhoon season | |
|---|---|
 Season summary map | |
| Seasonal boundaries | |
| First system formed | January 14, 1961 |
| Last system dissipated | December 14, 1961 |
| Strongest storm | |
| Name | Nancy |
| • Maximum winds | 345 km/h (215 mph) (1-minute sustained) |
| • Lowest pressure | 882 hPa (mbar) |
| Seasonal statistics | |
| Total depressions | 53 |
| Total storms | 35 |
| Typhoons | 20 |
| Super typhoons | 8 (unofficial) |
| Total fatalities | At least 308 |
| Total damage | Unknown |
| Related articles | |
The scope of this article is limited to the Pacific Ocean, north of the equator and west of the international date line. Storms that form east of the date line and north of the equator are called hurricanes; see 1961 Pacific hurricane season. Tropical storms formed in the entire west pacific basin were assigned a name by the Joint Typhoon Warning Center. Tropical depressions in this basin had the "W" suffix added to their number.
Systems

Tropical Storm Rita
| Tropical storm (JMA) | |
| Tropical storm (SSHWS) | |
  | |
| Duration | January 14 – January 19 |
|---|---|
| Peak intensity | 75 km/h (45 mph) (1-min) 996 hPa (mbar) |
A tropical low developed from the ITCZ about 140 miles to the south of Eauripik on January 8.[1] The low gradually deepened as it moved west-northwest during the following days. Early on January 14 the system organized itself enough to be classified as a tropical depression. The next day the depression strengthened into a tropical storm, and was named Rita by the Joint Typhoon Warning Center. Rita reached a peak intensity of 45 mph (75 km/h) and a minimal surface pressure of 996 hPa (29.4 inHg) on January 16.[2] At this time a cold front to the north and a subtropical ridge positioned behind it forced the storm to turn sharply to the north-northeast.[3] Rita began to, at this time, weaken, and became a depression on January 17. It remained a depression for the next three days. On January 19 Rita weakened to a remnant low and became attached to the tail-end of a passing front. By the 21 what was left of Rita became fully absorbed by the aforementioned front.[4]
Rita stayed largely at sea with little to minor effects to Palau or to the Mariana Islands, besides some rain and squally weather.
Tropical Depression Susan
| Tropical depression (JMA) | |
| Tropical storm (SSHWS) | |
  | |
| Duration | February 27 – March 1 |
|---|---|
| Peak intensity | 75 km/h (45 mph) (1-min) 1006 hPa (mbar) |
Typhoon Tess
| Typhoon (JMA) | |
| Category 4 super typhoon (SSHWS) | |
  | |
| Duration | March 22 – March 31 |
|---|---|
| Peak intensity | 240 km/h (150 mph) (1-min) 940 hPa (mbar) |
Tropical Depression Viola
| Tropical depression (JMA) | |
| Tropical storm (SSHWS) | |
  | |
| Duration | April 9 – April 11 |
|---|---|
| Peak intensity | 95 km/h (60 mph) (1-min) 1004 hPa (mbar) |
Typhoon Alice
| Typhoon (JMA) | |
| Category 1 typhoon (SSHWS) | |
  | |
| Duration | May 15 – May 20 |
|---|---|
| Peak intensity | 140 km/h (85 mph) (1-min) 980 hPa (mbar) |
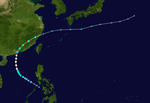
Typhoon Alice formed to the east of the Philippines on the 17th of May. Alice quickly strengthened and passed directly over Hong Kong with gusts of 85 mph on the 18th before recurving through the Chinese Mainland. The hurricane signal was again like Mary in 1960, not strictly justified as sustained winds were far-fledged from hurricane force. Sustained winds in Hong Kong never reached hurricane force; maximum 60-minute winds reached 90 km/h in Waglan Island and 83 km/h at the RHKO. 4 people were killed and 20 people were injured in Hong Kong.[5]
Typhoon Betty
| Typhoon (JMA) | |
| Category 4 typhoon (SSHWS) | |
  | |
| Duration | May 21 – May 28 |
|---|---|
| Peak intensity | 240 km/h (150 mph) (1-min) 945 hPa (mbar) |
Typhoon Cora
| Typhoon (JMA) | |
| Category 1 typhoon (SSHWS) | |
  | |
| Duration | June 21 – June 25 |
|---|---|
| Peak intensity | 130 km/h (80 mph) (1-min) 985 hPa (mbar) |
Tropical Storm 13W
| Tropical storm (JMA) | |
| Tropical depression (SSHWS) | |
  | |
| Duration | June 25 – June 29 |
|---|---|
| Peak intensity | 75 km/h (45 mph) (1-min) 996 hPa (mbar) |
Tropical Storm Doris
| Tropical storm (JMA) | |
| Tropical storm (SSHWS) | |
  | |
| Duration | June 27 – July 3 |
|---|---|
| Peak intensity | 85 km/h (50 mph) (1-min) 990 hPa (mbar) |
Typhoon Elsie
| Typhoon (JMA) | |
| Category 1 typhoon (SSHWS) | |
  | |
| Duration | July 6 – July 16 |
|---|---|
| Peak intensity | 150 km/h (90 mph) (1-min) 975 hPa (mbar) |
Tropical Storm Flossie
| Tropical storm (JMA) | |
| Tropical storm (SSHWS) | |
  | |
| Duration | July 11 – July 19 |
|---|---|
| Peak intensity | 85 km/h (50 mph) (1-min) 992 hPa (mbar) |
Tropical Depression Grace
| Tropical depression (JMA) | |
| Tropical storm (SSHWS) | |
  | |
| Duration | July 18 – July 25 |
|---|---|
| Peak intensity | 75 km/h (45 mph) (1-min) 997 hPa (mbar) |
Typhoon Helen
| Typhoon (JMA) | |
| Category 2 typhoon (SSHWS) | |
  | |
| Duration | July 22 – August 3 |
|---|---|
| Peak intensity | 165 km/h (105 mph) (1-min) 970 hPa (mbar) |
Typhoon Ida
| Typhoon (JMA) | |
| Category 1 typhoon (SSHWS) | |
  | |
| Duration | July 27 – July 31 |
|---|---|
| Peak intensity | 150 km/h (90 mph) (1-min) 980 hPa (mbar) |
Typhoon June
| Typhoon (JMA) | |
| Category 2 typhoon (SSHWS) | |
  | |
| Duration | August 1 – August 8 |
|---|---|
| Peak intensity | 175 km/h (110 mph) (1-min) 960 hPa (mbar) |
20 people were killed from heavy rain and mudslides when 90 mph Typhoon June hit southeastern Taiwan on August 6.
JMA Tropical Storm Fourteen
| Tropical storm (JMA) | |
  | |
| Duration | August 8 – August 10 |
|---|---|
| Peak intensity | Winds not specified 1000 hPa (mbar) |
Typhoon Kathy
| Typhoon (JMA) | |
| Category 1 typhoon (SSHWS) | |
  | |
| Duration | August 13 – August 18 |
|---|---|
| Peak intensity | 150 km/h (90 mph) (1-min) 988 hPa (mbar) |
Typhoon Lorna
| Typhoon (JMA) | |
| Category 4 typhoon (SSHWS) | |
  | |
| Duration | August 19 – August 27 |
|---|---|
| Peak intensity | 220 km/h (140 mph) (1-min) 950 hPa (mbar) |
Tropical Storm Marie
| Tropical storm (JMA) | |
| Tropical storm (SSHWS) | |
  | |
| Duration | August 28 – September 5 |
|---|---|
| Peak intensity | 95 km/h (60 mph) (1-min) 998 hPa (mbar) |
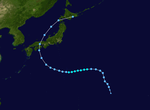
On September 29, a tropical depression formed with 30 knot winds. The system tracked westwards, briefly intensifying into a tropical storm. The system made landfall on the Japanese island of Shitoku as a tropical depression.[6]
Tropical Storm Olga
| Tropical storm (JMA) | |
| Category 1 typhoon (SSHWS) | |
  | |
| Duration | September 4 – September 11 |
|---|---|
| Peak intensity | 130 km/h (80 mph) (1-min) 985 hPa (mbar) |
On September 4, a low developed off of the eastern coast of the Philippines. Upon crossing into the South China Sea, the low became more organized and started dropping in pressure. On September 8, the system was upgraded to a tropical storm. The system continued to strengthen, and on September 9, it was designated as a typhoon by the JTWC. Typhoon Olga made landfall 50 kilometers to the north-east of Hong Kong, killing 7 people, mostly due to landslides. The system rapidly deteriorated over land, and dissipated 180 kilometers to the north-west of Hong Kong.[7][8]
Typhoon Pamela
| Typhoon (JMA) | |
| Category 5 super typhoon (SSHWS) | |
  | |
| Duration | September 5 – September 13 |
|---|---|
| Peak intensity | 285 km/h (180 mph) (1-min) 910 hPa (mbar) |
Typhoon Pamela, which formed on September 8, rapidly intensified to a peak of 180 mph on the 11th. Pamela weakened to a 145 mph typhoon by the time it hit eastern Taiwan late on the 11th, and after crossing the island and the Taiwan Strait, the storm hit eastern China as a 65 mph tropical storm. Pamela dissipated on the 12th, after causing 98 casualties (with 27 missing), $5 million in damage (1961 USD), and leaving 50,000 homeless.
Typhoon Nancy
| Typhoon (JMA) | |
| Category 5 super typhoon (SSHWS) | |
 | |
| Duration | September 6 – September 17 |
|---|---|
| Peak intensity | 345 km/h (215 mph) (1-min) 882 hPa (mbar) |
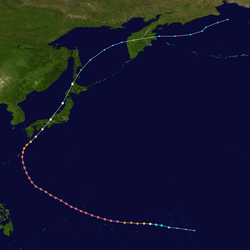
Tropical Storm Nancy, having developed on September 7 in the open West Pacific, rapidly intensified to reach super typhoon status early on the 9th. Nancy continued to strengthen, and reached peak winds of 215 mph (187 knots) on the 12th. Such intensity is speculative, as Reconnaissance Aircraft was in its infancy and most intensities were estimates. Furthermore, later analysis indicated that equipment likely overestimated Nancy's wind speed; if the measurements were correct, Nancy would have been tied with Hurricane Patricia for the highest wind speeds for a tropical cyclone on Earth. Regardless, Nancy was a formidable typhoon, and retained super typhoon status until the 14th as it neared Okinawa. The typhoon turned to the northeast, and made landfall on southern Japan on the 16th with winds of 100 mph. It continued rapidly northeastward, and became extratropical on the 17th in the Sea of Okhotsk. Well executed warnings lessened Nancy's potential major impact, but the typhoon still caused 172 fatalities and widespread damage.
Tropical Storm Ruby
| Tropical storm (JMA) | |
| Tropical storm (SSHWS) | |
  | |
| Duration | September 20 – September 24 |
|---|---|
| Peak intensity | 100 km/h (65 mph) (1-min) 992 hPa (mbar) |
Typhoon Sally
| Typhoon (JMA) | |
| Category 1 typhoon (SSHWS) | |
  | |
| Duration | September 23 – October 1 |
|---|---|
| Peak intensity | 130 km/h (80 mph) (1-min) 980 hPa (mbar) |
Typhoon Tilda
| Typhoon (JMA) | |
| Category 5 super typhoon (SSHWS) | |
  | |
| Duration | September 25 – October 5 |
|---|---|
| Peak intensity | 260 km/h (160 mph) (1-min) 925 hPa (mbar) |
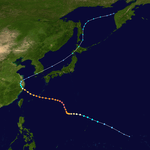
A circulation was first reported from a ship 300 miles west of Guam on September 26. The system then quickly intensified into a typhoon, and made a northward turn directly towards Japan. During this period, a favorable environment allowed the typhoon to intensify to peak winds of 160 mph. The storm then turned westwards, passing 15 miles under Okinawa. The town of Naha, Okinawa received sustained winds of 85 mph with gusts of 120 mph. The much weakened typhoon made landfall on the Chinese mainland 100 miles south of Shanghai on October 4. It caused 11 deaths, over $6 million in crop damage, and the Lebanese merchant ship Sheik ran aground off of Kitadaitōjima, killing 2. The Taiwanese military exercise Sky Soldier was canceled due to the typhoon. The system then recurved outwards due to westerly winds into the Sea of Japan with sustained winds of 30 mph. The remnants began an extratropical transition and dissipated in the Sea of Okhotsk.[9]
Typhoon Violet
| Typhoon (JMA) | |
| Category 5 super typhoon (SSHWS) | |
  | |
| Duration | October 2 – October 10 |
|---|---|
| Peak intensity | 335 km/h (205 mph) (1-min) 895 hPa (mbar) |
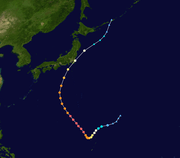
Violet was first observed as a small circulation to the southwest of Marcus Island. On October 2, the system had organized enough to warrant further investigation. After a few days of observation, a report of tropical storm force winds was relayed back to the JTWC and on October 4, it was upgraded to Tropical Storm Violet. Violet took an unusual track, moving in a southern direction after formation. This was due to its location west of a high-pressure system, which the storm struggled to move around. After completing a curve to the south of the ridge, Violet quickly intensified into a typhoon. The movement of the subtropical ridge to the east resulted in Violet turning abruptly to the northwest. Violet continued to intensify and soon reached its peak intensity, on October 7, with sustained winds of 205 mph (335 km/h) and a minimal surface pressure of 886 hPa (26.2 inHg);[10] however, the wind readings during this era of reconnaissance were erroneously high. Violet moved in a smooth path northward and clipped the Boso Peninsula area of Japan, near Tokyo. After landfall, Violet began to transition into an extratropical cyclone and continued to move northward. By October 10, Violet had become fully extratropical.[11]
Violet was an intense storm, yet did not impact any landmass at or near peak intensity. On Guam damages were light, mostly consisting to crop damage. The effects on Japan were generally minimal due in part to early preparation. A 9124-ton freighter, The Pioneer Muse, was left stranded on the Daitō Islands during the passing of the typhoon on October 9. All men on board were saved and later the cargo of military hardware was scavenged.[12] Another ship, The Sheik, also was stranded a few miles from The Pioneer Muse, it would later break in two due to rough seas. Two fatalities were reported in Japan due to the passage of Violet.[11]
Tropical Storm Wilda
| Tropical storm (JMA) | |
| Tropical storm (SSHWS) | |
  | |
| Duration | October 5 – October 13 |
|---|---|
| Peak intensity | 110 km/h (70 mph) (1-min) 990 hPa (mbar) |
Wilda was first record on October 5 over the South China Sea, near the western coast of Luzon. The system moved to the southwest, neared the coast of Vietnam, but abruptly turned in the opposite direction on October 8. The depression completed an elongated clockwise loop and continued to the southeast. The depression gradually deepened and by October 11 Wilda became a tropical storm while curving in a west direction. Wilda reached a peak intensity of 70 mph (110 km/h) and a minimal surface pressure of 990 hPa (29 inHg) before making landfall on Vietnam.[13] Wilda proceeded to dissipate a short time later.[14]
Wilda contributed to an already rain drenched area of Cambodia and Vietnam. The extra rain caused the flood level to reach the highest since 1937 along the Mekong River.[14]
Tropical Depression Anita
| Tropical depression (JMA) | |
| Tropical storm (SSHWS) | |
  | |
| Duration | October 18 – October 21 |
|---|---|
| Peak intensity | 65 km/h (40 mph) (1-min) 1004 hPa (mbar) |
Anita first formed to the north of Busuanga Island on October 18. It traveled in a generally westward direction over the South China Sea, and intensified into a tropical storm later that day. On October 19 the storm weakened slightly before making landfall on Vietnam. Anita rapidly weakened into a remnant low on October 20. The low tracked over Indochina before emerging over the Bay of Bengal and completely dissipated on October 22.[15] The remaining moisture may have helped aid the development of a tropical depression, on October 22, near present-day Rakhine.[16]
Impact, if any, was minimal or disconcernable from the previous tropical system Wilda, which had struck a week before.
Typhoon Billie
| Typhoon (JMA) | |
| Category 1 typhoon (SSHWS) | |
  | |
| Duration | October 18 – October 29 |
|---|---|
| Peak intensity | 130 km/h (80 mph) (1-min) 970 hPa (mbar) |
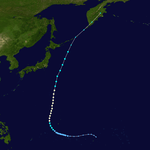
Billie originated from an extensive area of low pressure near Pohnpei. The Japan Meteorological Agency first picked up on the system on October 18 as it tracked to the west. The organization, at first, was poor as multiple vortices were present within the circulation.[11] One of these vortices split from the main circulation and became a weak tropical depression while it moved southwest. Over the next few days one circulation became dominant and the whole system began to strengthen. The first warning was issued by the JTWC on October 23, by that time the cyclonic radius extended over 1,000 nautical miles from the center.[11] Quickly the system strengthen into a tropical storm, and by midday October 24, had become a typhoon. Billie began to curve to the north during this time; passing to the south of Guam. The radius of Billie had also decreased to 750 nautical miles, which it remained constant throughout the rest of its life. The size of Billie's eye was comparable to the extensive radius of the circulation. At times the eye measured over 180 miles in diameter, an eye size not matched by any of the other typhoons during this season.[11] By this time, October 26, Billie had reached a peak intensity of 80 mph (130 km/h) and a minimal surface pressure of 961 hPa (28.4 inHg).[17] The large typhoon continued almost straight north, maintaining its intensity, before encountering a polar front. It merged with the associated low pressure area near the Kuril Islands on October 30. At this point Billie had completely translated into an extra-tropical low and passed over the Kamchatka Peninsula.[11]
Despite Billie's rather large size it did not pass over any significant land mass. The biggest impact to land was at Iwo Jima where strong winds and excess rain occurred. No damage; however, was reported. Billie contributed to the sinking of a Japanese freighter, The Fukazan Maru. A leak in the vessel's hold caused the ship to slowly sink. All 47 crew members were rescued and safely transported to Guam.[11]
Typhoon Clara
| Typhoon (JMA) | |
| Category 1 typhoon (SSHWS) | |
  | |
| Duration | October 25 – November 1 |
|---|---|
| Peak intensity | 140 km/h (85 mph) (1-min) 985 hPa (mbar) |
Clara had formed form a vortex embedded within the ITCZ near Enewetak Atoll. The circulation was pulled north by the influence of Typhoon Billie. The storm had organized enough that by October 25 it was classified as a tropical depression by the JMA. Gradually intensifying as it moved to the northeast, the first warning was issued by the JTWC on October 26 as sea surface reports indicated Clara was a tropical storm.[11] By October 27 Clara had intensified into a typhoon and started a small clockwise loop that was completed by October 28. Soon after Clara had reached a peak intensity of 85 mph (140 km/h) and a minimal surface pressure of 984 hPa (29.1 inHg).[18] Moving in a westward direction Clara weakened back into a tropical storm. Clara continued to gradually weaken over the next few days, performing swaying movements in its track. On November 1 Clara turned to the north and transitioned into an extra-tropical low after encountering a polar front.[11]
Clara remained mostly over open ocean during its life; however, its path did near a few minor islands. No damage was reported, but there were possibilities that damage to shipping or small islands occurred.[11]
Typhoon Dot
| Typhoon (JMA) | |
| Category 5 super typhoon (SSHWS) | |
  | |
| Duration | November 7 – November 15 |
|---|---|
| Peak intensity | 260 km/h (160 mph) (1-min) 930 hPa (mbar) |
The origin of Dot can be traced back to a compact low pressure center over open water to the east of Guam on November 7. Moving in a zig-zag pattern the system quickly organized into a typhoon late on November 8. Initially it wasn't until November 9 that when pilots traversing the Pacific reported the existence of an area of severe weather to the northeast of Guam. Reconnaissance investigation of the storm had found a fully developed typhoon. It was likely, due to the small size of Dot, that it would not to have been discovered before it reached the Mariana Islands, had it not passed through a route used by trans-Pacific aircraft.[11] Dot moved in a near westward direction after being discovered, passed through the Mariana Islands, and gradually intensifying into a category five super typhoon to the northwest of Guam. On November 11 Dot reached a peak intensity of 160 mph (260 km/h) and a minimal surface pressure of 923 hPa (27.3 inHg).[19] During this time Dot began to curve to the northeast, weakening gradually from the influence of a trough to the north. By November 13 the typhoon had weakened to a category three and was accelerating to the northeast. This motion was carried on for three days before Dot transitioned into an extra-tropical low on November 15.[11] The extra-tropical low traversed the rest of the Pacific Ocean and made landfall over Southern California on November 20.[14] The low continued over the Rocky Mountains, weakened, then regenerated over the western Gulf of Mexico states. From there it crossed into the Atlantic Ocean and was finally absorbed by another low pressure area off the East Coast on November 26.[20]
Impacts from Dot were mostly confined to its passing of the Mariana Islands. Damage to Alamagan was substantial.[11] The extra-tropical low of Dot dumped one to five inches of rain over the Southwest U.S. and contributed to excessive rainfall over the New England area.[20]
Typhoon Ellen
| Typhoon (JMA) | |
| Category 4 typhoon (SSHWS) | |
  | |
| Duration | December 5 – December 14 |
|---|---|
| Peak intensity | 240 km/h (150 mph) (1-min) 945 hPa (mbar) |
Ellen originated from a low pressure area near Chuuk Lagoon where data supported a closed circulation;However, it had soon moved into a data void to the south of Guam early in December. The low developed into a tropical depression with well-defined spiral storm bands and a closed circulation early on December 5. The depression moved westward, and passed to the north of Palau. It organized itself into a tropical storm on December 7 and underwent rapid intensification. By the December 8, the cyclone had become an intense typhoon with winds of 115 mph (185 km/h) and a sea surface pressure of 970 hPa (29 inHg). An eye wall was observed during this time. By December 9, Ellen had reached a peak intensity of 150 mph (240 km/h) and a minimal pressure of 946 hPa (27.9 inHg).[21] During this time Ellen made its closest approach to land. Ellen began to weaken on December 10 as it curved to the northeast. By December 11, the typhoon reached a secondary peak intensity, and small hail was observed within the eye during this time. On December 13, the circulation had become poorly defined and Ellen weakened back to a tropical storm. Ellen dissipated on December 14 while moving in a northeastern direction out into the open ocean.[11]
Ellen was the most destructive typhoon of 1961 for the Philippines. Impacts from Ellen were most severe on Catanduanes island when the center passed within ten miles from the northern point of the island. The eye during this time was about thirty-six miles across and had winds of 150 mph within the eye wall. Damages were placed at about $500,000 at the Coast Guard Loran Station[22] while damage elsewhere is estimated at about ₱2 million. Several people were reported either missing or dead.[23] A Panamanian freighter carrying logs to Hong Kong sank in the South China Sea, near the Spratly Islands, due to squally weather on December 9. Thirty-three of the crew members were lost to the turbulent sea.[14]
Storm names
|
|
|
|
See also
- 1961 Atlantic hurricane season
- 1961 Pacific hurricane season
- 1961 North Indian Ocean cyclone season
- List of Australian region cyclones before 1969
Sources
- Climatological Data. National Atmospheric Administration, National Environmental Satellite, Data, and Information Service, National Climatic Center. 1962.
- Mariners Weather Log. Environmental Data and Information Service. 1962.
References
- "Northern Hemisphere Synoptic Weather Map" (PDF). United States of America Department of Commerce. 1961. Retrieved 26 December 2013.
- National Climatic Data Center (2013). "Rita IBTrACS File". National Oceanic and Atmospheric Administration. Retrieved 26 December 2013.
- "Northern Hemisphere Synoptic Weather Map" (PDF). United States of America Department of Commerce. 1961. Retrieved 26 December 2013.
- "Northern Hemisphere Synoptic Weather Map" (PDF). United States of America Department of Commerce. 1961. Retrieved 26 December 2013.
- Joint Typhoon Warning Center (2011-06-06). "Chapter IV: Individual Typhoons of 1961" (PDF). United States Navy. Archived from the original (PDF) on June 6, 2011. Retrieved 2013-04-02.
- EDIS, p. 21
- Hong Kong Observatory (2013-01-10). "Casualties and Damage Caused by Tropical Cyclones in Hong Kong since 1960". The Government of the Hong Kong Special Administrative Region. Retrieved 2013-04-02.
- NAA, p. 590
- NAA, p.591
- National Climatic Data Center (2013). "Violet IBTrACS File". National Oceanic and Atmospheric Administration. Retrieved 14 June 2013.
- Joint Typhoon Warning Center (1962). "Annual Typhoon Report 1961" (PDF). United States Navy. Retrieved 2013-04-02.
- Rosendal, Hans (January 1962). "Mariners Weather Log". Six (one). United States Weather Bureau: 24. Cite journal requires
|journal=(help) - National Climatic Data Center (2013). "Wilda IBTrACS File". National Oceanic and Atmospheric Administration. Retrieved 5 April 2013.
- Rosendal, Hans (May 1962). "Mariners Weather Log". Six (three). United States Weather Bureau: 101. Cite journal requires
|journal=(help) - National Climatic Data Center (2013). "Anita IBTrACS File". National Oceanic and Atmospheric Administration. Retrieved 2 April 2013.
- India Meteorological Department (1961). "India Weather Review, 1961:Annual Summary" (PDF). Government of India. Retrieved 26 June 2014.
- National Climatic Data Center (2013). "Billie IBTrACS File". National Oceanic and Atmospheric Administration. Retrieved 1 April 2013.
- National Climatic Data Center (2013). "Clara IBTrACS File". National Oceanic and Atmospheric Administration. Retrieved 31 March 2013.
- National Climatic Data Center (2013). "Dot IBTrACS File". National Oceanic and Atmospheric Administration. Retrieved 31 March 2013.
- United States Weather Bureau (1962). "The Weather and Circulations of November 1961" (PDF). United States Weather Bureau. Retrieved 3 April 2013.
- National Climatic Data Center (2013). "Ellen IBTrACS File". National Oceanic and Atmospheric Administration. Retrieved 30 March 2013.
- "TYPHOON ELLEN" (PDF). loran-history.info. 1961. Retrieved 30 March 2013.
- Republic of the Philippines Annual Report of the Weather Bureau Fiscal Year 1960-61. United States Weather Bureau. 1961. Retrieved 30 March 2013.
External links
- Japan Meteorological Agency
- Joint Typhoon Warning Center.
- China Meteorological Agency
- National Weather Service Guam
- Hong Kong Observatory
- Macau Meteorological Geophysical Services
- Korea Meteorological Agency
- Philippine Atmospheric, Geophysical and Astronomical Services Administration
- Taiwan Central Weather Bureau
- Digital Typhoon - Typhoon Images and Information
- Typhoon2000 Philippine typhoon website